Figure 5.
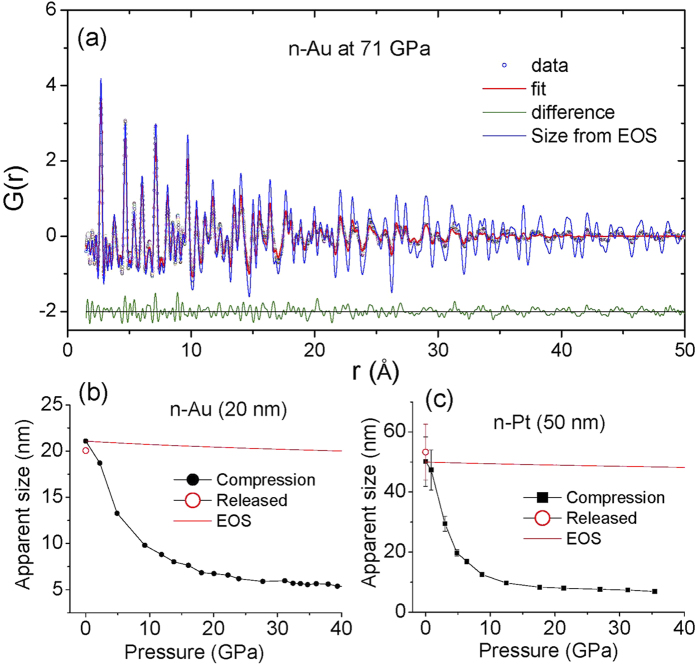
(a) PDF of nano-crystalline Au (20 nm) at 71 GPa using focused 81.400 keV X-rays. Points represent the G(r) up to Qmax = 20 Å−1 for the Fourier transform from an average of 200 individual measurements (5 s each). Lines are the PDF fitting with a residual, Rw, of 0.244. The blue line shows the calculated PDF assuming the size of nano Au at 71 GPa is reduced from the ambient pressure value (20 nm) solely by the effect of compression as determined by the equation of state. (b) Evolution of the nano-domain size of n-Au (20 nm at ambient) compared to the effect of compression alone as given by the Au EOS31 (red line). The error bar is smaller than the symbol size. (c) Evolution of the nano-domain size of n-Pt (50 nm at ambient) as a function of pressure. Red line shows the reduction in nano-particle size due to compression using the EOS for Pt31. The open circles in (b,c) indicate data obtained on pressure release.

