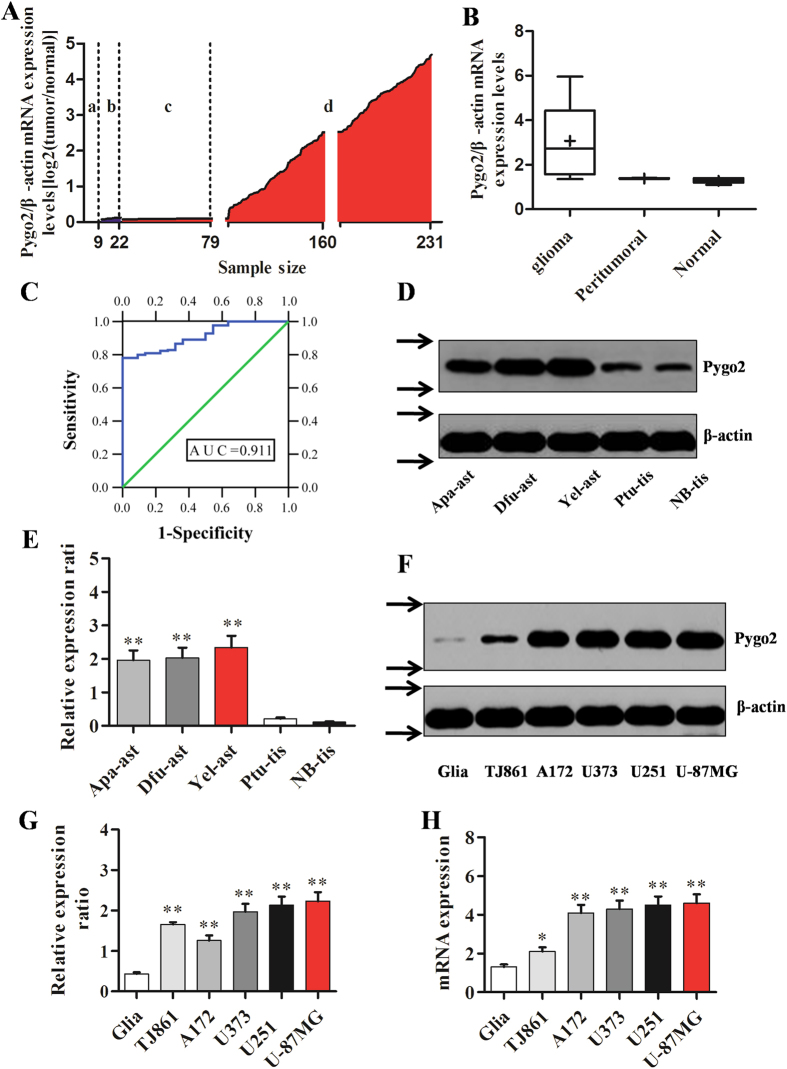
Figure 1. Expression of Pygo2 in primary glioma tissues and cell lines.
(A) Pygo2 mRNA expression was examined by qRT-PCR in 231 human tissues composed of 9 normal tissues (a), 13 peritumoral tissues (b) and 209 human glioma tissues (c,d). Pygo2 expression was normalized to β-actin in each sample. (B) Box plot of human Pygo2 expression in 9 normal, 13 peritumoral and 209 glioma tissues. Boxes represent interquartile ranges, and the horizontal lines across each box indicate median values. (C) The ROC curve of Pygo2 expression in glioma patients from normal subjects. The Pygo2 expression levels made an area under the curve (AUC) value of 0.91, with a standard error of 0.02 and 95% confidence interval of 0.88–0.94, based on the method used by Delong et al. 1998. (D,E) The Pygo2 protein levels in anaplastic astrocytoma (Apa-ast), astrocytoma (Dfu-ast), astrocytoma (Yel-ast), peritumoral (Ptu-tis) tissues and Normal brain tissue (NB-tis, control). Statistical data were obtained from three independent measurements as mean ± SD. (F–H) The Pygo2 protein and mRNA levels in 5 Glioma cell lines, TJ861, A172, U373, U251, and U-87MG. Normal human microglia cells (Glia) were used as a control. Arrows (→) (panel F) indicate cropping lines. Full-length blots/gels are presented in Supplementary Figure 1 and were obtained under the same experimental conditions. Data were presented as mean ± SD. Two-tailed Student’s t-test was used. *P < 0.05 and **P < 0.01.

