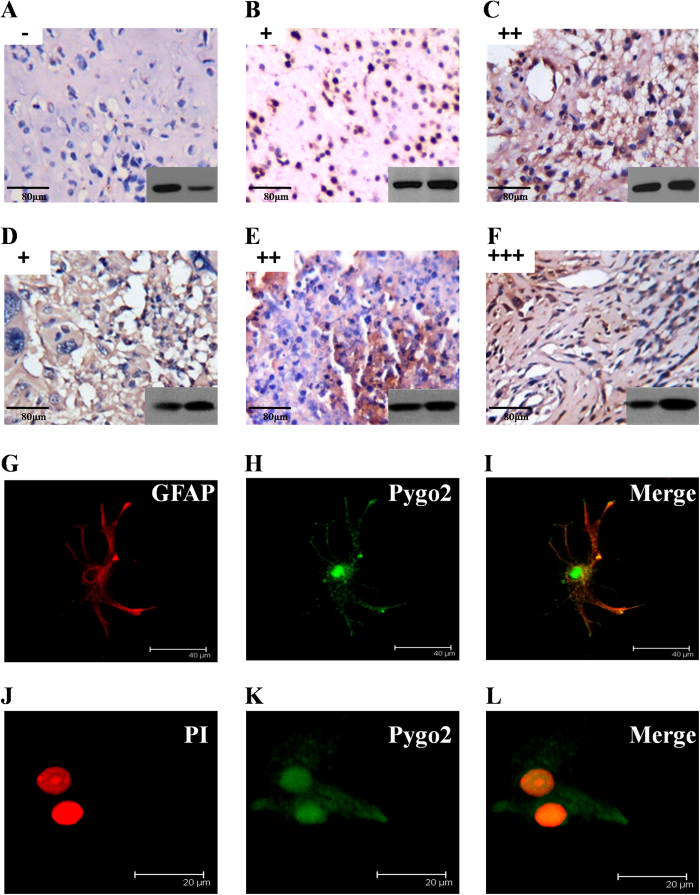
Figure 3. Nuclear localization of Pygo2 in glioma tissues and cell lines.
(A–F) Pygo2 protein expression in glioma was classified by the intensity and frequency of tumor cell nuclei staining with Pygo2 antisera, and further classified as negative (−), weak (+, <70% nuclei staining), moderate (++, 70–90% nuclei staining), or strong +++, >90% nuclei staining). Negative (−) or weak (+) Pygo2 staining was detected in the nuclei of normal and peritumoral tissues (A). Weak (+) or moderate (++) Pygo2 nuclear staining was detected in astrocytoma and anaplastic astrocytoma (B,C). Weak (+) to strong (+++) Pygo2 nuclear staining was detected in glioblastoma multiforme (D–F). Original magnification was ×200. Bar, 80 μm. Western blotting images in the right bottom corner shows the Pygo2 expression levels. (G–I) Double staining for fibrillary acidic protein (GFAP)/red and Pygo2/green (astrocytes) in rat primary astrocytes. Pygo2 antisera were detected with fluorescein-conjugated secondary antibodies, and GFAP monoclonal antibodies detected with TRITC conjugated secondary antibodies. They were viewed under a fluorescence microscope. Bar 40 μm. (J–L) Double staining for Propidium Iodide/red and Pygo2/green (astrocytes) in rat primary astrocytes. Astrocytes were stained simultaneously with nuclear-specific Propidium Iodide, and Pygo2 antisera detected with fluorescein-conjugated secondary antibodies. Bar 20 μm.

