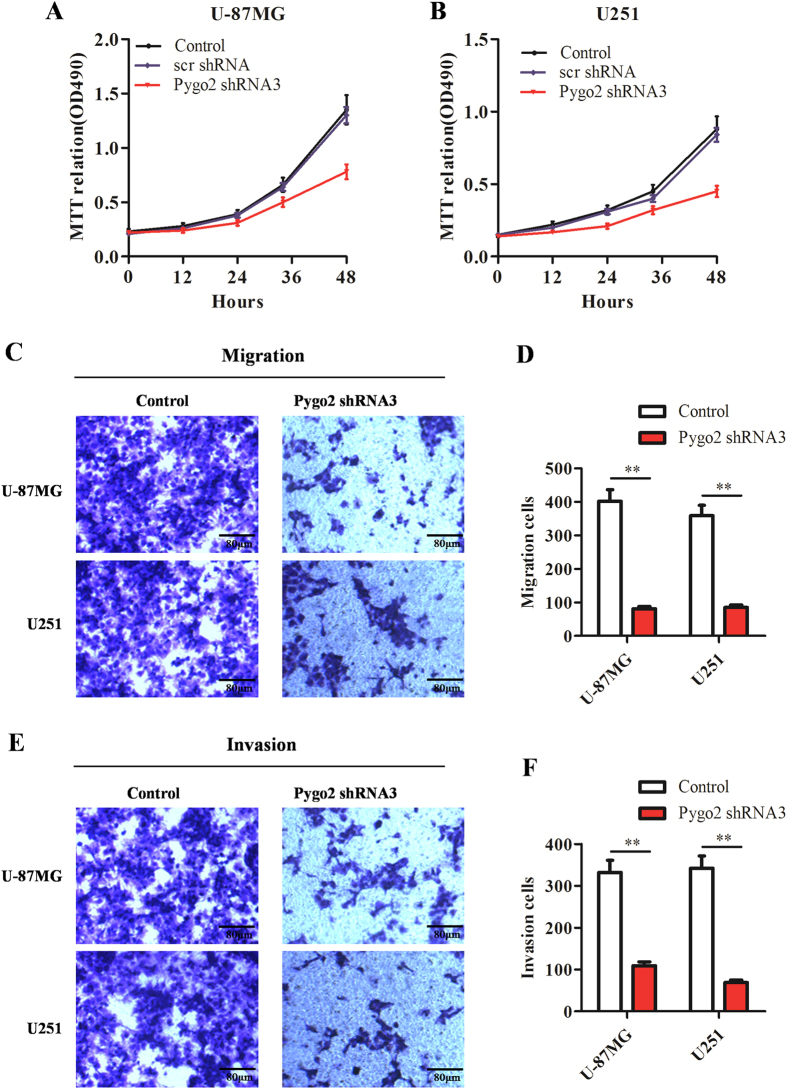
Figure 7. Effects of Pygo2 shRNA knockdown on glioma cell proliferation, migration and invasion.
(A,B) Cell proliferation analysis by MTT assays using U-251 and U-87MG glioma cells with or without Pygo2 knockdown. Shown data were from three independent measurements (mean ± SD). (C–F) Effects of Pygo2 on migration and invasion of U-87MG and U251 glioma cells. Representative micrographs and statistical data showing the effects of Pygo2 knockdown on cell migration (C,D) and invasion (E,F). Data were presented as mean ± SD. Two-tailed Student’s t-test was used. *P < 0.05 and **P < 0.01.

