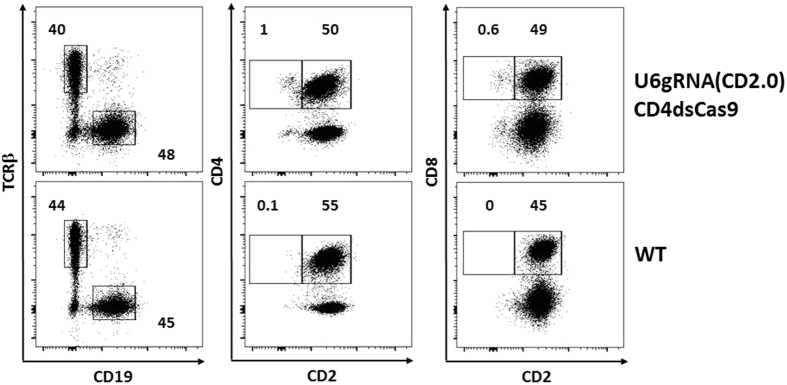
Figure 3. Abrogation of CD2 expression on a small population of lymph node/splenic T cells.
Flow cytometric analysis of pooled lymphocytes from lymph nodes and spleens of two double transgenic and wildtype mice. Shown are live cells within a lymphocyte gate. The four plots on the right are additionally gated on TCRβ+ cells. The percentages of cells found within the marked gates of the dot plot analysis are indicated.

