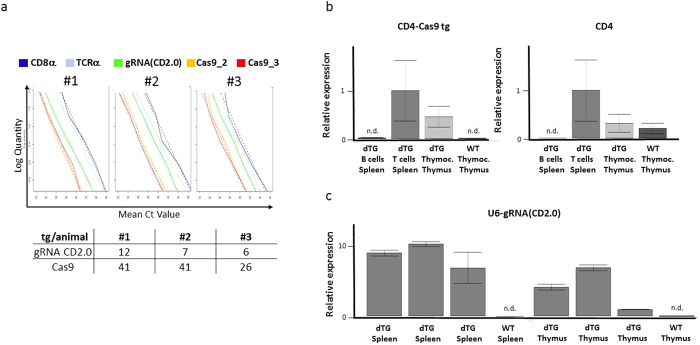
Figure 4. Analysis of transgene copy numbers and mRNA expression levels.
(a) Serial dilutions of genomic DNA from three F1 offspring of founder #5 (Fig. 1c) were analyzed by real-time PCR specific for sequences within the indicated (trans)genes. A regression analysis was performed to calculate the copy number of the transgenes in each individual mouse, as indicated in the table. (b) Relative expression of CD4-Cas9 transgenic and endogenous CD4 mRNA. Transgenic splenic B cells, T cells and thymocytes as well as wildtype thymocytes were magnetically enriched and analyzed by RT-PCR. The CD4-Cas9 product is spanning the intron between CD4 Exon 1 and Cas9 ORF. Cxxc1 and Ywhaz served as housekeeping gene. Data was normalized to “dTG T cells Spleen”. (c) Relative expression of gRNA(CD2.0). Splenocytes and thymocytes of three different dTG offspring as well as of a wildtype control were analyzed by RT-PCR. Cxxc1 and Ywhaz served as housekeeping gene. Data was normalized to “dTG Thymus” of the third offspring.

