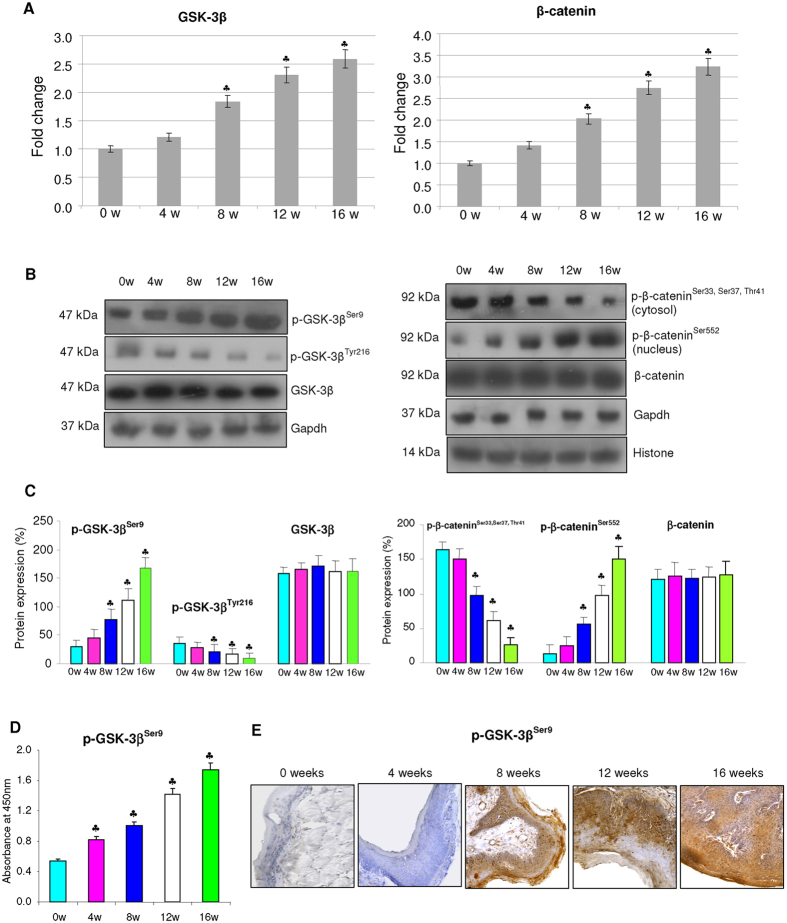
Figure 1. mRNA and protein expression of GSK-3β and β-catenin during the sequential progression of HBP carcinomas (mean ± SD; n = 3).
(A) Transcript expression level of GSK-3β and β-catenin in control and DMBA painted hamster groups as determined by quantitative RT-PCR. The fold change in transcript expression for each gene was determined using the 2−ΔΔCt method. Data are the mean ± SD of three independent experiments. Statistical significance was determined by the Mann–Whitney test (p < 0.05). (B) Immunblots showing expression levels of GSK-3β and β-catenin in control and DMBA treated animals. Gapdh and histone H2B were used as loading control for cytosol and nuclear proteins respectively. (C) Background subtracted protein bands were quantified and normalized to Gapdh. Phosphorylated proteins are normalized by their unphosphorylated forms. Each bar represents the protein expression ± SD of three determinations.(D) p-GSK-3βSer9 quantitated by ELISA showing a progressive increase fro 0 to 16 weeks of DMBA painting. (E) Representative immunostaining showing the expression of p-GSK3βSer9 in various cellular compartments in control and experimental animals (×20). p < 0.05 versus control. The groups are indicated as 0w (0 weeks), 4w (4 weeks), 8w (8 weeks), 12w (12 weeks), 16w (16 weeks).

