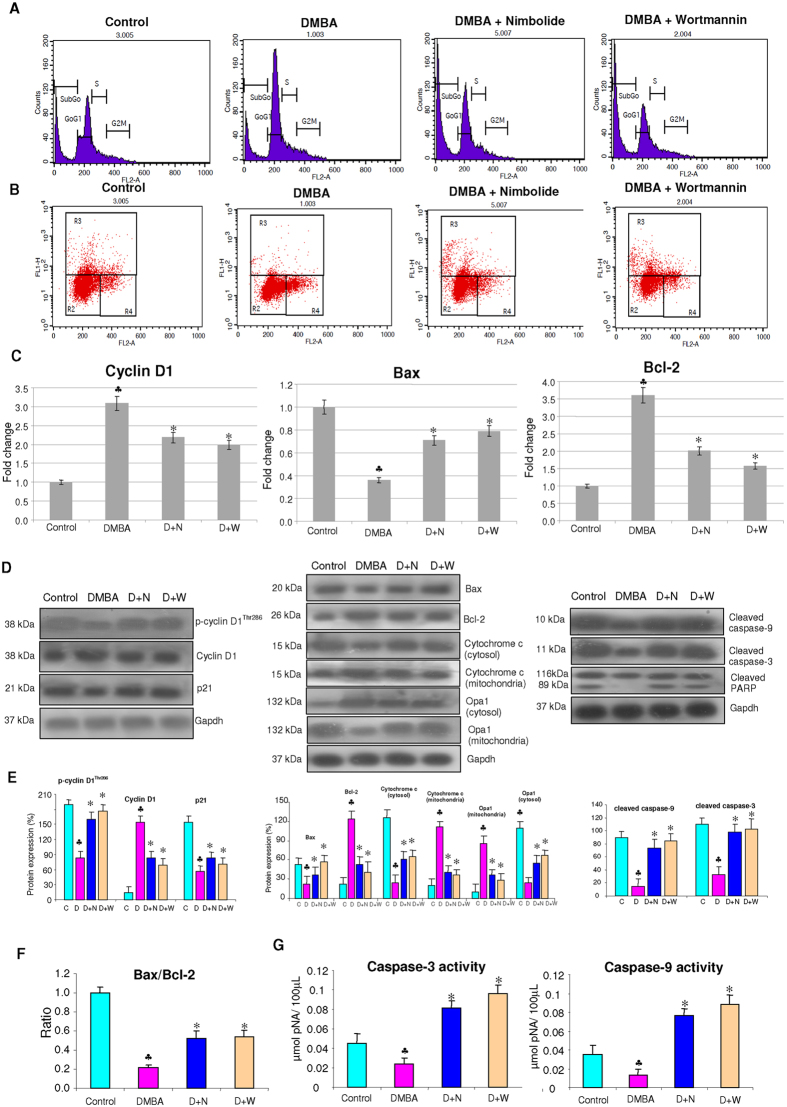
Figure 6. Effect of nimbolide on the mRNA and protein expression of markers of cell proliferation and apoptosis.
(A) Flow cytometry analysis of the cell cycle in nimbolide and wortmannin treated animals. SubG0 cells represent apoptotic cells with lower DNA content. The data presented are representative of three independent experiments. (B) TUNEL assay by flow cytometry in hamster buccal pouch tissues. R3 region shows TUNEL positive cells. (C) Quantitative RT-PCR analysis of cyclin D1, Bax and Bcl-2. Data are the mean ± SD of three separate experiments. Statistical significance was determined by the Mann–Whitney test (p < 0.05). (D) Expression of proteins involved in cell cycle and apoptosis were analysed by western blotting. Gapdh was used as loading control. (E) Background subtracted protein bands quantified and normalized to Gapdh. Each bar represents the protein expression ± SD of three determinations. (F) Histogram representing Bax/Bcl-2 ratio in different groups. (G) The activities of caspase-3 and caspase-9 using colorimetric assay kits. Enzyme activities were significantly increased in nimbolide and wortmannin treated animals compared to DMBA painted hamsters. ♣ significantly different from control (p < 0.05). * significantly different from DMBA-treated group (p < 0.05).

