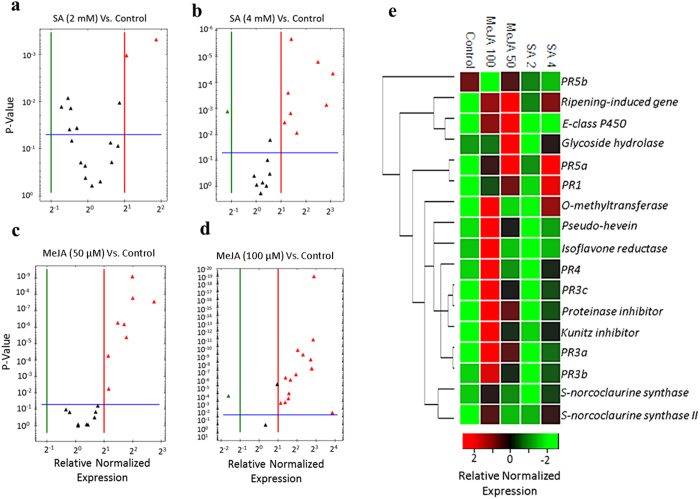
Figure 7. Gene expression analysis of disease-responsive genes after treatments with SA or MeJA.
(a–d) Volcano plots showing the magnitude of differential expression between control (0.01% ethanol) and treatments with SA (2 mM), SA (4 mM), MeJA (50 μM) or MeJA (100 μM). The horizontal line marks the threshold (P < 0.05) for defining a gene as up-regulated in control (black) or treatment (red), with a combined change > 2-fold. (e) A clustergram with a red/black/green color scheme to show genes where the expression upregulated, unchanged or down regulated, respectively, compared to control.

