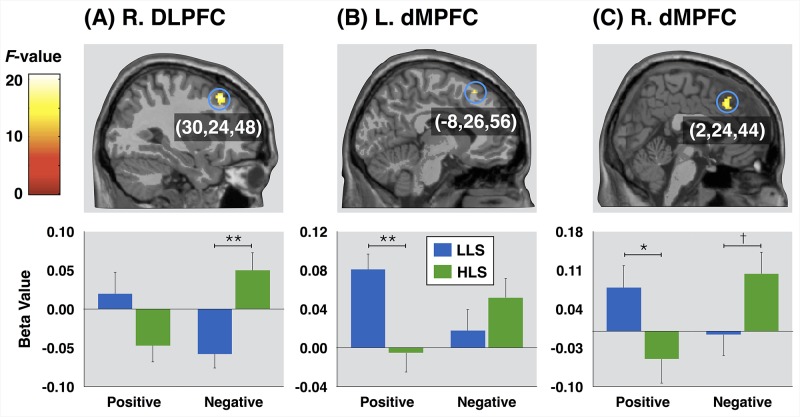
Fig 2. Brain regions showing the interaction effect between group and word valence and post-hoc analyses for group differences (**p<0.01; *p<0.05; and †p = 0.05).
Error bars represent standard errors. R., right; L., left; DLPFC, dorsolateral prefrontal cortex; dMPFC, dorsal medial prefrontal cortex; LLS, low life satisfaction group; and HLS, high life satisfaction group.

