
Figure 4.
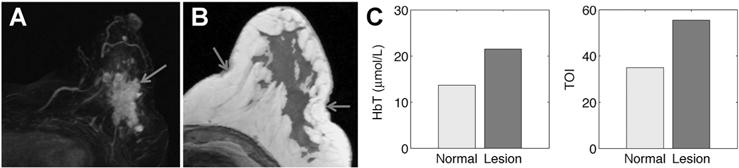
MRI/optical results for patient 54 (lesion size: 20 × 59 × 40 mm, MRI: BIRADs 5, path: IDC). Post-contrast MRI MIP image shows abnormality location (A) and enhancement pattern. An MRI-based region map (B) segmented from T1 MRI was used to guide optical reconstruction and arrows show locations of optical fibers. C, Graphs of HbT and TOI contrast correctly characterize the lesion as malignant based on ROI to normal contrast greater than 0.94 and 0.88, respectively.