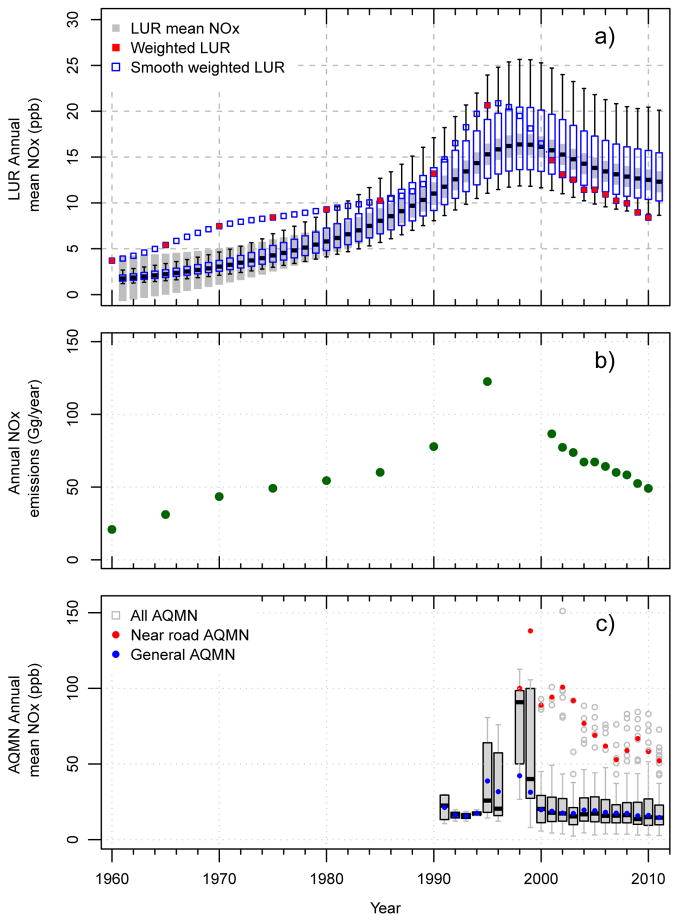
Figure 3.
Time series of: a) boxplots of the LUR prediction over residential areas (50 m domain) with the mean of the prediction error over that area (gray shading), as well as weighted LUR prediction according to the national emissions and a smoothing weighted LUR prediction; b) reconstructed national NOx emissions from vehicles; c) annual boxplots of NOx measured at all available AQM sites, mean NOx at near road sites (red) and general sites (blue).

