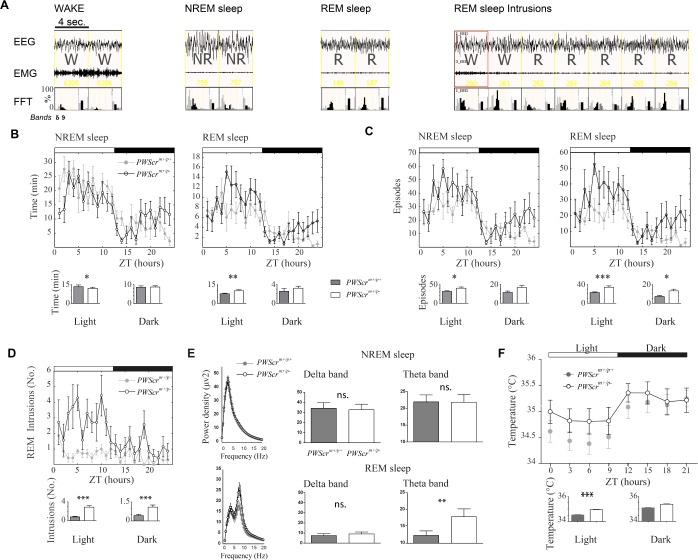
Figure 2.
Sleep profiling in PWScrm+/p− mutant mice versus controls. (A) Example of electroencephalographic traces (i.e. electroencephalography and electromyography) scored as wakefulness, nonrapid eye movement (NREM) sleep, rapid eye movement (REM) sleep, and REM intrusions. Fast Fourier transforms (FFTs) are represented for each epoch in which delta (light gray bars) and theta (black bars) are plotted. (B) Total time spent asleep per hour in NREM and REM sleep across the 24 h in PWScrm+/p− mice versus controls. (C) Amount of episodes of sleep, NREM and REM sleep, per hour, across the 24 h in PWScrm+/p− mice versus controls. An episode is intended as one or more consecutive epochs of the same stage (i.e. wake [W], NREM sleep or REM sleep). (D) REM sleep intrusions during wakefulness in mutants versus control mice. (E) Power densities of the whole spectrum of frequencies and detailed histograms for delta and theta EEG frequencies (μV2) in NREM and REM sleep in mutants versus control mice in the light phase. (F) Peripheral temperature of PWScrm+/p− mice and controls across 24 h. Histograms show the sleep and temperature means ± standard error of the mean (SEM), in the light and dark phases, of the two genotypes. All graphs are presented as mean ± SEM across 24 h. Light and dark phases are indicated by the white and black strips on top of each graph. ZT, Zeitgeber time. Statistical significance is represented as follows: *P < 0.05; **P < 0.01; ***P < 0.001.

