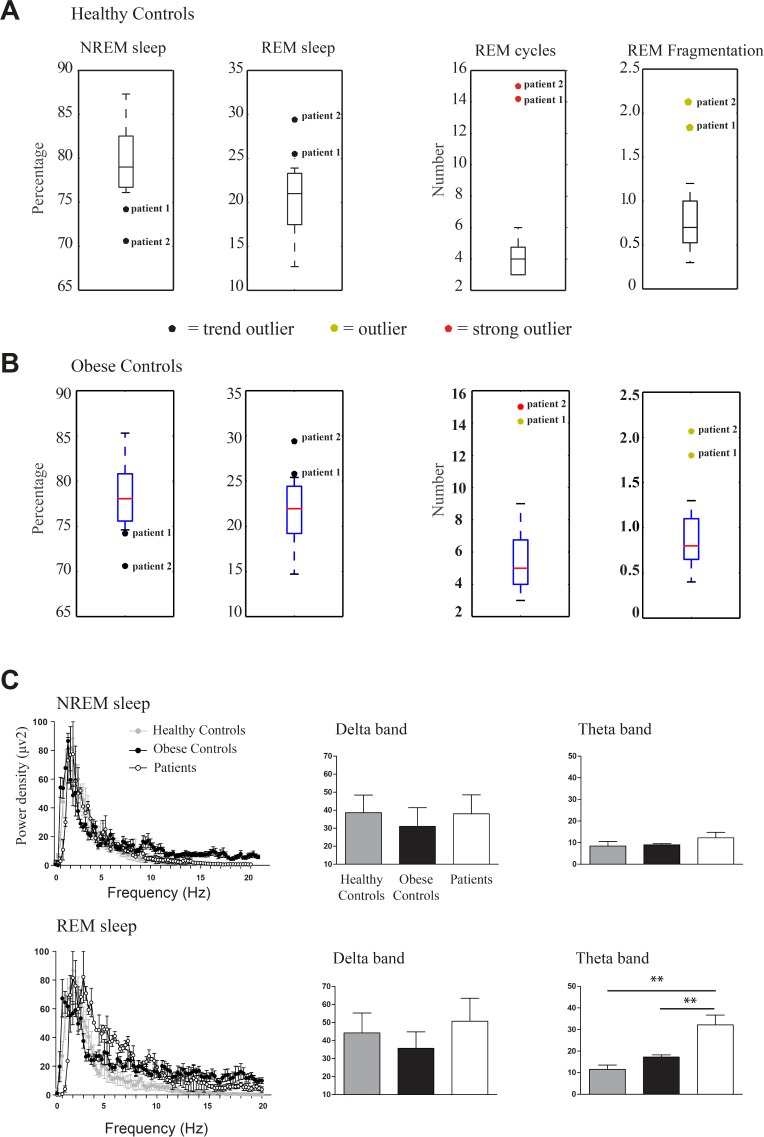
Figure 3.
Sleep in patients with Prader-Willi syndrome compared to healthy and obese control groups. Boxplots of percentages of nonrapid eye movement (NREM) and rapid eye movement (REM) sleep, number of REM sleep cycles and REM sleep episodes for healthy controls (A) and obese subjects (B); colored circles indicate the outlier position of the two patients respect to the control distributions. (C) Power densities of the whole spectrum of frequencies and detailed histograms for delta and theta electroencephalographic frequencies (μV2) in NREM and REM sleep in patients, healthy and obese individuals. Graphs are presented as mean ± standard error of the mean; **P < 0.01.

