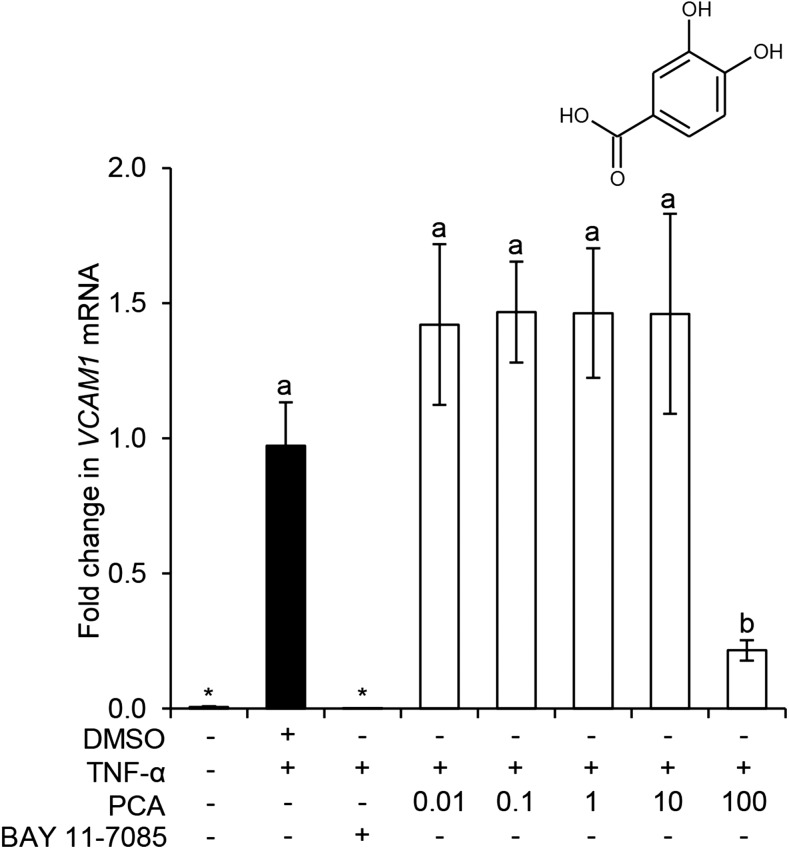
FIGURE 5.
Effect of concentration of PCA on TNF-α–stimulated VCAM-1 mRNA expression in HUVECs. Data were normalized to a TNF-α control, and columns represent the mean ± SD (n = 3 independent measures). Labeled means without a common letter differ, P ≤ 0.05 (ANOVA with post hoc LSD). *Different from DMSO, P ≤ 0.05 (t test). HUVEC, human umbilical vein endothelial cell; LSD, least square difference; PCA, protocatechuic acid; VCAM, vascular cellular adhesion molecule.

