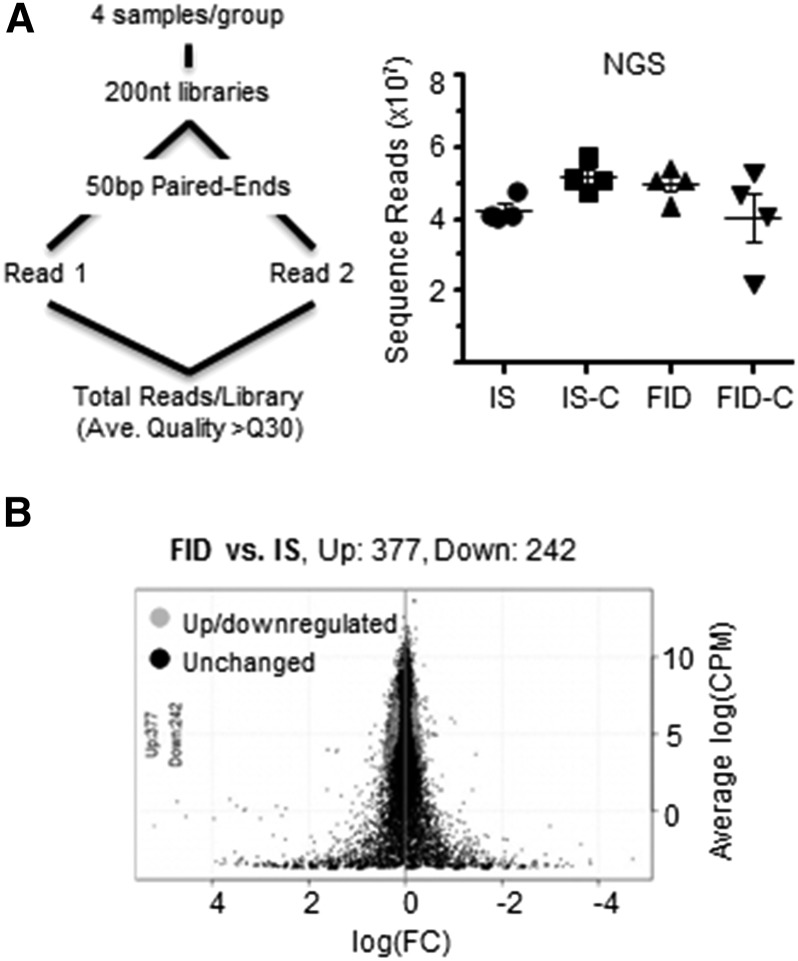
FIGURE 1.
RNA-Seq data generated from PND65 male rat hippocampus following gestational iron deficiency with or without choline supplementation. (A) Flow chart of RNA sample preparation and sequencing by Illumina HiSeq. The right panel shows total NGS reads from RNA libraries for each diet group. (B) Log(FC) plot shows differentially expressed genes between FID and IS data sets. Ave., average; bp, base pairs; CPM, count per million; Down, downregulated. FC, fold change; FID, formerly iron-deficient; FID-C, FID choline; IS, iron sufficient; IS-C, IS choline; NGS, next generation sequencing; nt, nucleotides; PND, postnatal day; Up, upregulated.

