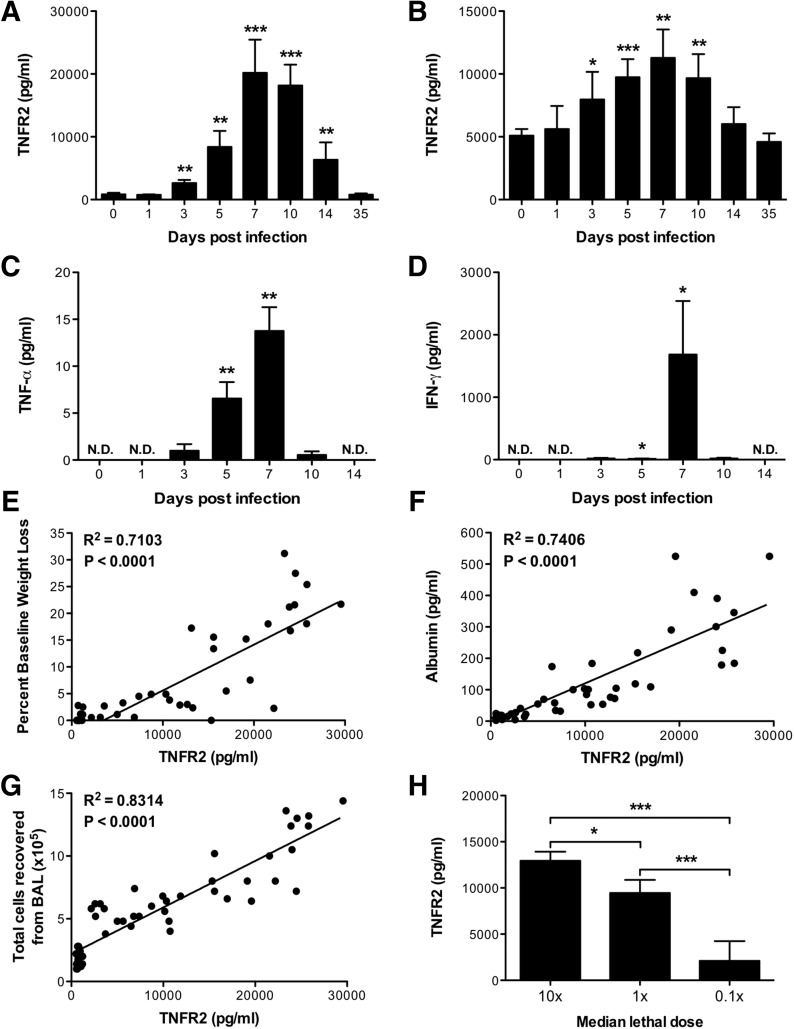
Figure 2. solTNFR2 levels are increased after influenza infection in mice.
WT mice were infected with A/PR/8/34 influenza virus, and solTNFR2 levels in the (A) airway and (B) serum were assessed by ELISA on the days indicated. Airway levels of (C) solTNF-α and (D) IFN-γ were analyzed by ELISA on the days indicated. The levels in influenza-infected mice were compared with baseline values from naive mice for statistical analysis (*P < 0.05; **P < 0.01; ***P < 0.005). N.D., not detected. The correlations of (E) percent baseline weight change, (F) airway albumin levels, or (G) total cells recovered from the airway with airway solTNFR2 levels throughout the course of infection were determined by linear regression analysis. The slope of each linear regression was found to be significantly nonzero (<0.0001), as calculated from an F test. (H) WT mice were infected with 10, 1, or 0.1 times the median lethal dose of A/PR/8/34 influenza virus, and on day 7 postinfection, solTNFR2 levels in the airway were assessed by ELISA. Data represent means ± sd. Data are representative of 2 independent experiments with 3–5 mice/group. *P < 0.05; ***P < 0.005.

