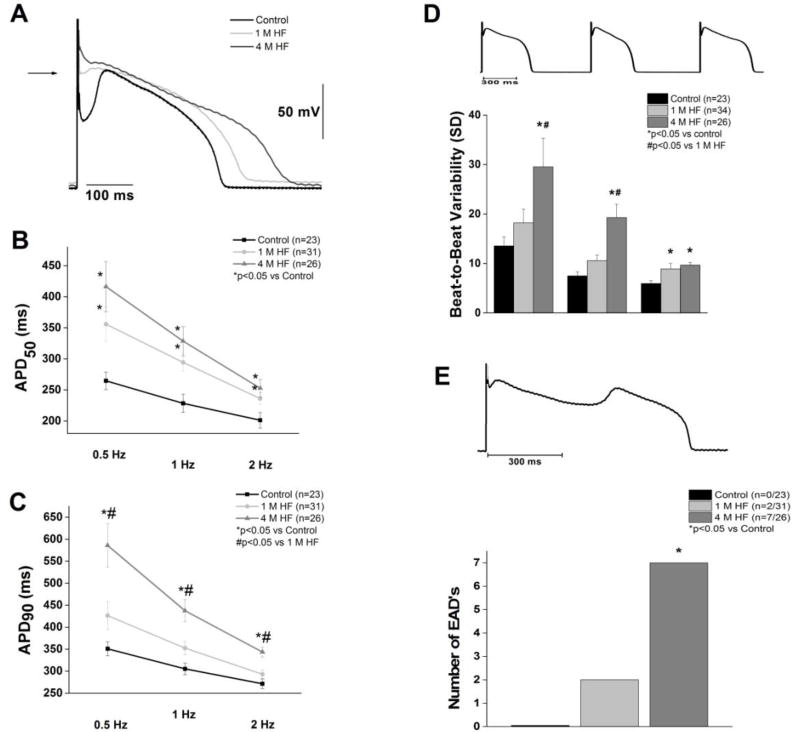
Figure 2. Progressive action potential prolongation and cellular arrhythmias during heart failure.

A. Representative action potentials at 1 Hz. B. APD50 is prolonged at 1 and 4 months of HF (p<0.05). C. APD90 is significantly prolonged in 4 M HF compared to 1 M HF and control (p<0.05). D. Beat-to-beat variability (representative, top) was significantly increased in 4 M HF (*p<0.05 vs. control, #p<0.05 vs. 1M HF). E. Early afterdepolarizations (representative, top) were more frequent in 4 M HF (*p<0.05 vs control).
