
Figure 3. HF decreases Ito.
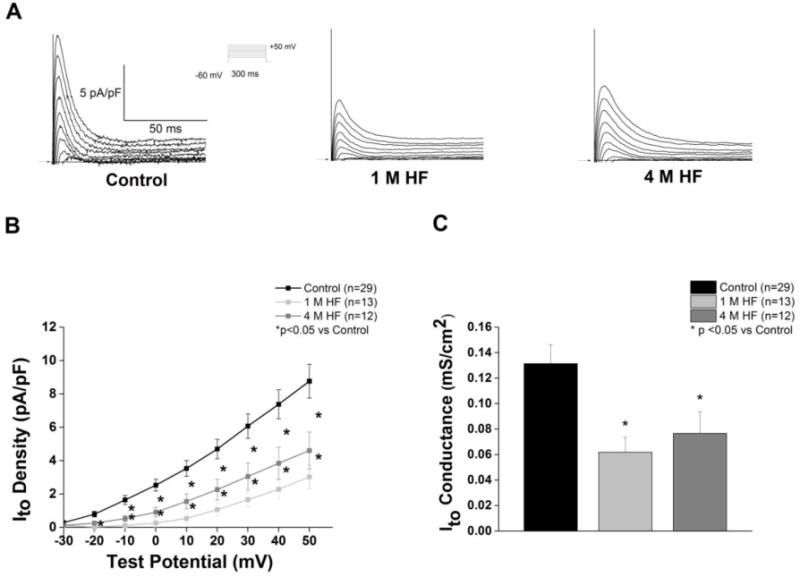
A. Representative Ito current tracings from each group; voltage protocol shown in the inset. B. I–V curves (*p<0.05 vs. control) C. Ito slope conductance is decreased in HF (*p<0.05).
Official websites use .gov
A
.gov website belongs to an official
government organization in the United States.
Secure .gov websites use HTTPS
A lock (
) or https:// means you've safely
connected to the .gov website. Share sensitive
information only on official, secure websites.
A. Representative Ito current tracings from each group; voltage protocol shown in the inset. B. I–V curves (*p<0.05 vs. control) C. Ito slope conductance is decreased in HF (*p<0.05).