Figure 5.

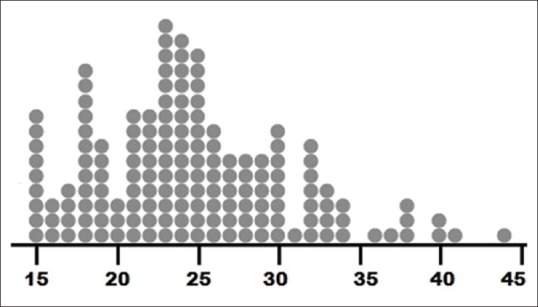
A dot plot depicting age of 156 women in reproductive age group enrolled in a study. Note that individual values are conserved while distribution, gaps and clusters are evident

A dot plot depicting age of 156 women in reproductive age group enrolled in a study. Note that individual values are conserved while distribution, gaps and clusters are evident