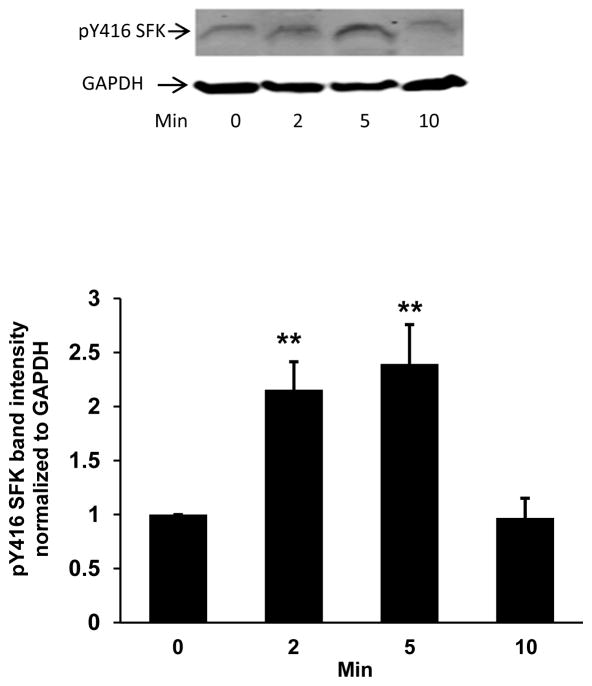
Fig. 6.
Western blot showing the time course of Src family kinase (SFK) activation in the epithelium of lenses incubated in control Krebs solution for 1 – 10 min after receiving 5 μl of hyperosmotic NaCl solution injected ~1 mm beneath the capsule of the posterior pole. The typical western blot shows pY416-SFK (upper) and GAPDH (lower), which was used as a loading control. The bar graph shows densitometric analysis of pY416-SFK normalized to GAPDH. The data are the mean ± SEM of results from 3 independent experiments. **(p<0.01) indicates a significant difference compared to band density at time zero (control).

