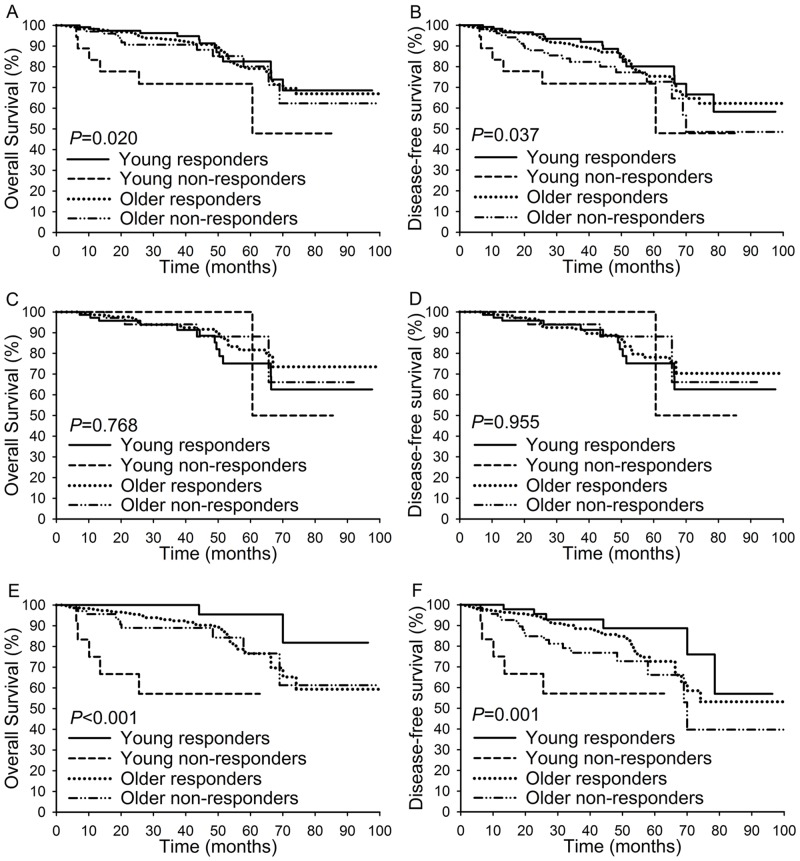
Fig 2. Overall survival and disease-free survival compared among patients of different subgroups.
(A-B): The comparison of OS and DFS among the young responders subgroup, young non-responders subgroup, older responders subgroup, and older non-responders subgroup. (C-D): The comparison of OS and DFS among the young responders subgroup, young non-responders subgroup, older responders subgroup, and older non-responders subgroup among patients with FIGO stage IB1-IB2 disease. (E-F): The comparison of OS and DFS among the young responders subgroup, young non-responders subgroup, older responders subgroup, and older non-responders subgroup among patients with FIGO stage IIA-IIB disease.

