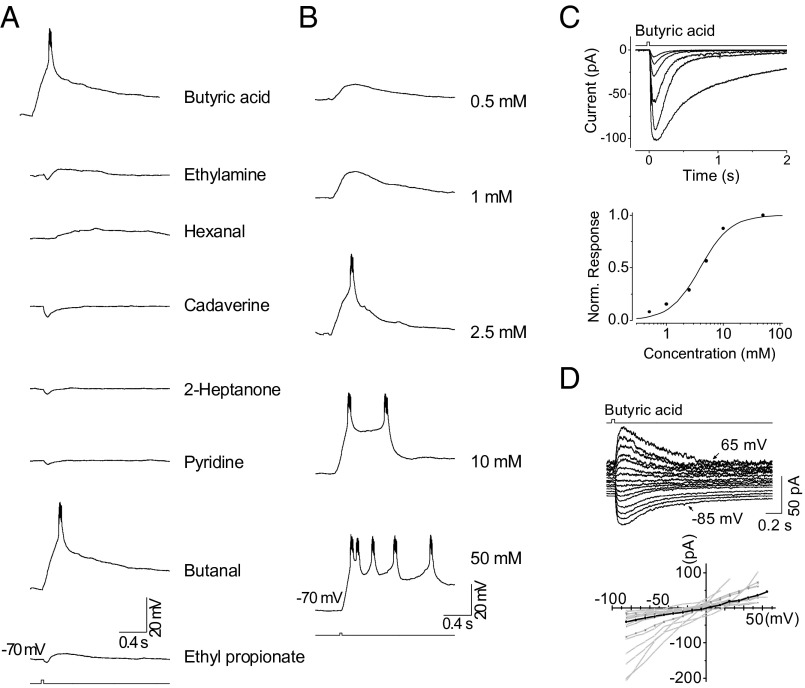
Fig. 3.
The odor responses of Ir-expressing OSNs. (A) Odor spectrum. Traces show the voltage responses (current clamped) elicited by the indicated odors. Each odor was delivered at 25 mM and applied for 35 ms. (B) The dose dependence of spike firing. The same Ir-OSN as that in A is shown. Traces show the membrane depolarization elicited by 35-ms pulses of butyric acid at the indicated concentrations. (C) The odor response family (Top) and dose–response relationship (Bottom). A 35-ms pulse of butyric acid at concentrations of 0.5, 1, 2.5, 5, 10, and 50 mM. The curve fit to the dose–response relationship is the Hill equation (K1/2 = 4.0 mM, m = 1.6). (D, Top) Current–voltage relationship of the response of an OSN to butyric acid (35 ms, 25 mM). The cell is stepped from −85 to 65 mV in 10-mV increments. (Bottom) Collected current–voltage relationships from 17 Ir-expressing OSNs, with responses elicited by butyric acid. Black dots (interconnected by straight lines) correspond to data from the OSN at the Top.

