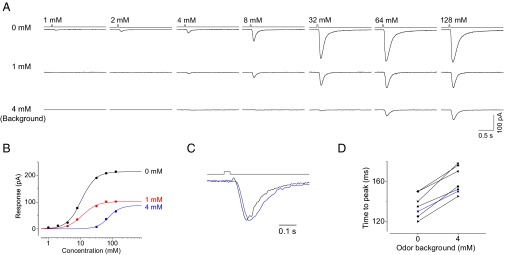
Fig. 5.
Changes in the sensitivity and response kinetics by adaptation. (A) Incremental responses in Or22a-expressing OSNs to 35-ms pulses of ethyl propionate with no background (Top) or 1 mM (Middle) and 4 mM (Bottom) ethyl propionate backgrounds. (B) The dose–response relationship for incremental responses. The peak amplitudes of the incremental responses are plotted against concentrations, with black, red, and green symbols representing data for no background, and 1 and 4 mM ethyl propionate backgrounds, respectively. The background-induced responses are similar to those in Fig. 4 A and C. (C) Changes in the response kinetics by adaptation. Normalized small responses in experiments with and without a 4 mM ethyl propionate background. (D) The collective time-to-peak values for weak responses with and without a 4 mM ethyl propionate background.

