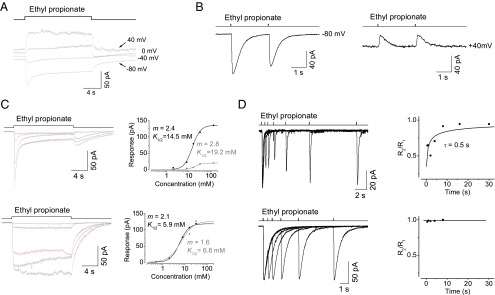
Fig. 6.
The voltage and Ca2+ dependence of adaptation. (A) The voltage dependence of step adaptation. Odor stimulation: 20-s steps of 50 mM ethyl propionate. Holding potentials are as indicated. (B) The voltage dependence of paired-pulse responses. Left and right panels were obtained from the same OSN. Odor stimulation: 35-ms pulses of 50 mM ethyl propionate at an interval of 4 s. Holding potentials at −80 mV (Left) and +40 mV (Right). Note the abolishment of the reduction in second-pulse–triggered receptor current at +40 mV. (C) The Ca2+ dependence of step adaptation. The top and bottom panels are from the same OSN. Adaptation (Left, Top) is abolished after removing extracellular Ca2+ (Left, Bottom), with traces for 8 mM ethyl propionate marked in red. (Right) The dose–response relationships at a transient peak and in the steady state are represented with black and gray symbols, respectively. (D) The Ca2+ dependence of paired-pulse adaptation. Top and bottom panels were obtained from the same OSN. Odor stimulation: 35-ms pulses of 50 mM ethyl propionate. Note that adaptation (Left, Top) is abolished when extracellular Ca2+ is removed (Left, Bottom). The response ratio at transient peaks between the two pulses plotted against the intervals (Right).

