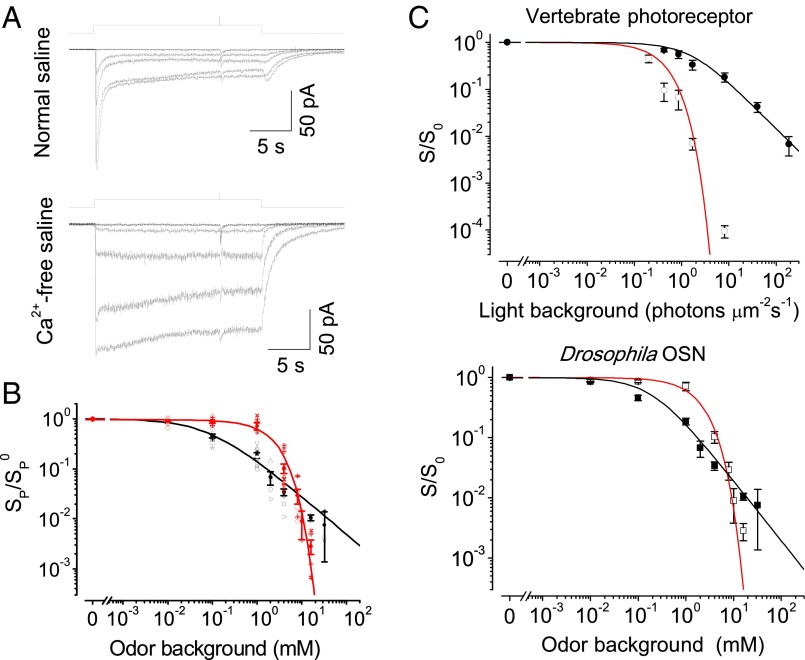
Fig. 7.
Gain control during adaptation. (A) Incremental sensitivity under background adaptation. The top and bottom panels were obtained from the same OSN. Odor backgrounds: 20-s steps of ethyl propionate at various concentrations. Incremental pulses: 35-ms pulses of ethyl propionate at various concentrations. Normal saline (Top) and Ca2+-free saline (Bottom). (B) The normalized odor sensitivity against background concentrations. Black and red symbols represent data in the presence and absence of extracellular Ca2+, respectively. The fit in black represents the Weber–Fechner relation, SPB/Sp = 1/[1 + (CB/C0)] with C0 = 0.09 mM; the fit in red represents the saturating exponential function, SPB/Sp = exp(−kCB), where k is a constant of 0.4 mM−1. (C) Model results and experimental data. (Top) The normalized photosensitivity of vertebrate photoreceptors, with data points extracted from figure 2b in ref. 40. (Bottom) The same data as that shown in B for Drosophila OSNs. The red curves are fit with S/S0 = exp(−u0/KNA), and the black curves are fit with S/S0 = exp[−u0/(K0 +α u0)] × [K0/(K0 + α u0)], with parameters specified in Fig. S4.

