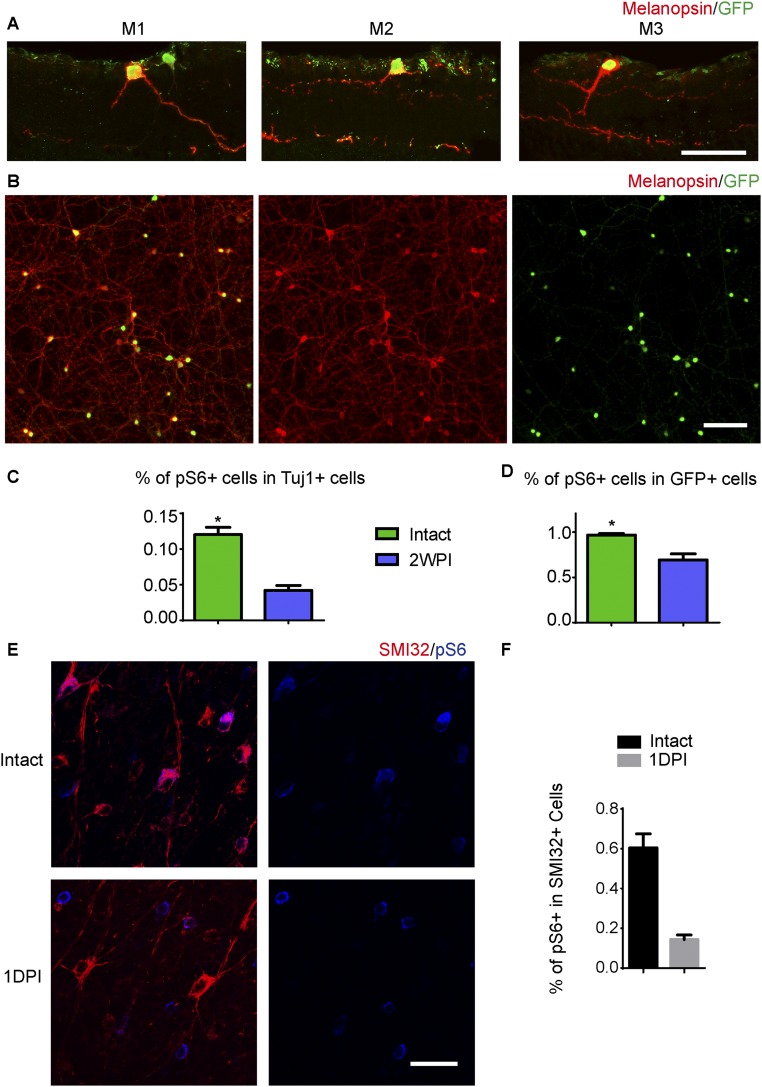
Fig. S1.
Differential mTOR activation in M1–M3 ipRGCs and αRGCs upon axotomy. (A) GFP-labeled M1–M3 ipRGC subtypes in the retina of an Opn4-GFP mouse. Colocalization between GFP (green) and melanopsin (red) staining is shown to illustrate dendritic stratification in the inner plexiform layer, between the inner nuclear layer and the ganglion cell layer. (B) Image of a whole-mounted retina showing double labeling for GFP (green) and melanopsin (red) in Opn4-GFP mice. More than 90% of the GFP+ cells were costained with the melanopsin antibody. (C) Quantification of the percentages of Tuj1+ RGCs that express pS6 in intact and 2WPI retinas of Opn4-GFP mice. (D) Quantification of the percentage of GFP+ ipRGCs that express pS6 in intact and 2WPI retinas. *P < 0.05, Student’s t test, three mice in each group. (E) Whole-mount retinas from WT mice with intact optic nerves or at 1 d postinjury (1DPI). Retinas were stained with SMI32 (red) and pS6 (blue) antibodies. SMI32 labels αRGCs. (F) Quantification of the percentages of SMI32+ αRGCs that express pS6 in intact and 1DPI retinas. *P < 0.05, Student’s t test, three mice in each group. (Scale bars: A, 50 μm; B, 100 μm; E, 15 μm.)

