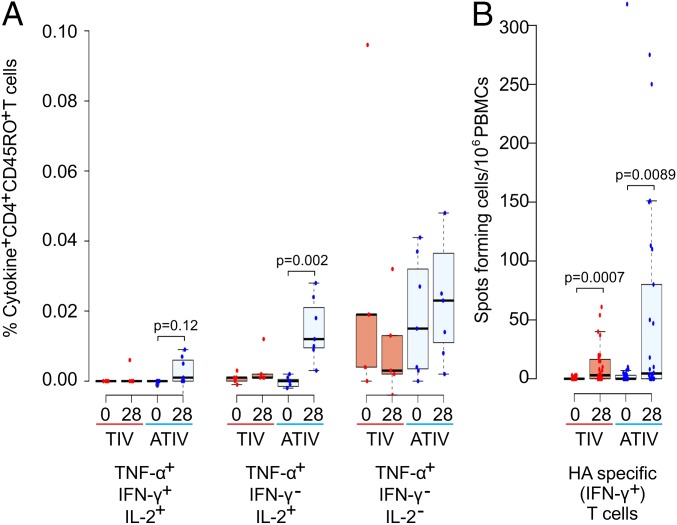
Fig. 2.
Expansion of multicytokine-producing vaccine-specific CD4+ T cells. (A) Percentage of cytokine-producing vaccine-specific CD4+ T cells before immunization and 28 d postboost in TIV- (blue) and ATIV- (red) vaccinated individuals, respectively. Significant differences are indicated (Wilcoxon signed-rank test, n = 12). TNF-α+, IFN-γ+, IL-2− T cells and TNF-α− T cells are not illustrated because no difference was found. (B) IFN-γ ELISpot assays were used to identify hemagglutinin-specific T cells. Significant differences are indicated (Wilcoxon signed-rank test, TIV n = 27, ATIV n = 26).

