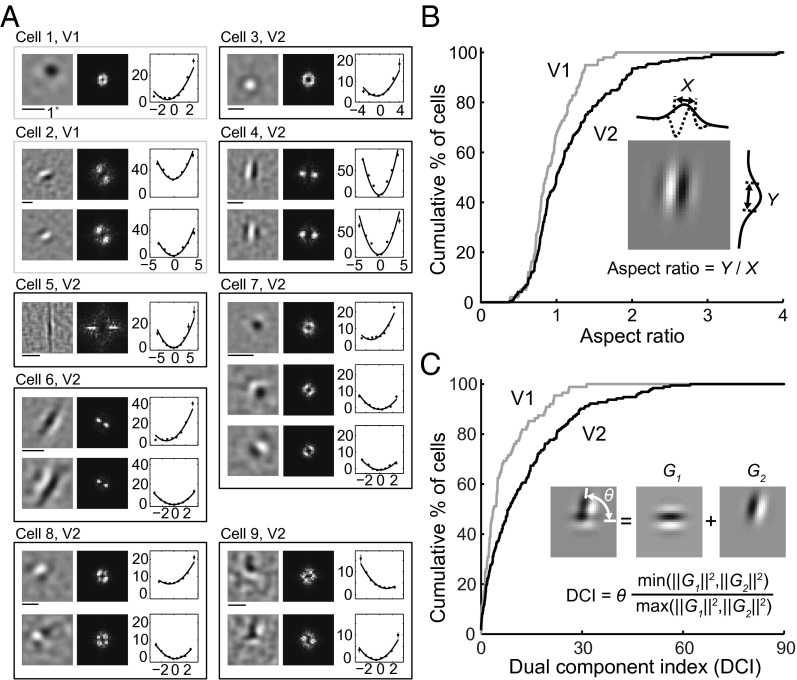
Fig. 2.
RF subunits identified by PPR. (A) Example V1 and V2 RFs. Each box contains subunits from one cell (gray, V1; black, V2). Cell 1, V1 cell with a center-surround subunit. Eccentricity (Ecc), 2.4°. (Left) Linear filter. (Center) RF spectrum. (Right) Nonlinear function (data points in spikes/s; error bars, SEM; curves, polynomial fits). Cell 2, V1 cell with two Gabor subunits. Ecc, 7.6°. Cell 3, V2 cell with a center-surround subunit. Ecc, 3.7°. Cell 4, V2 cell with two Gabor subunits. Ecc, 2.2°. Cells 5 and 6, V2 cells with ultralong subunits. Ecc, 2.2° and 2.1°. Cells 7–9, V2 cells with complex-shaped RF subunits. Ecc, 2°, 3°, and 3.8°. (B) Cumulative distributions of aspect ratio for V1 (n = 99) and V2 (n = 223) cells. (Inset) Gabor fit for subunit 1 of cell 4. X and Y, widths of Gaussian envelope (SD) orthogonal and parallel to the sine wave grating. AR of each cell was averaged from all excitatory subunits. (C) Cumulative distributions of DCI for V1 (n = 88) and V2 (n = 193) cells. (Inset) Fit of subunit 2 of cell 9 by sum of two Gabors (G1, G2). θ, angle between two Gabors; ‖G‖2, . The DCI of each cell was averaged from all excitatory subunits.

