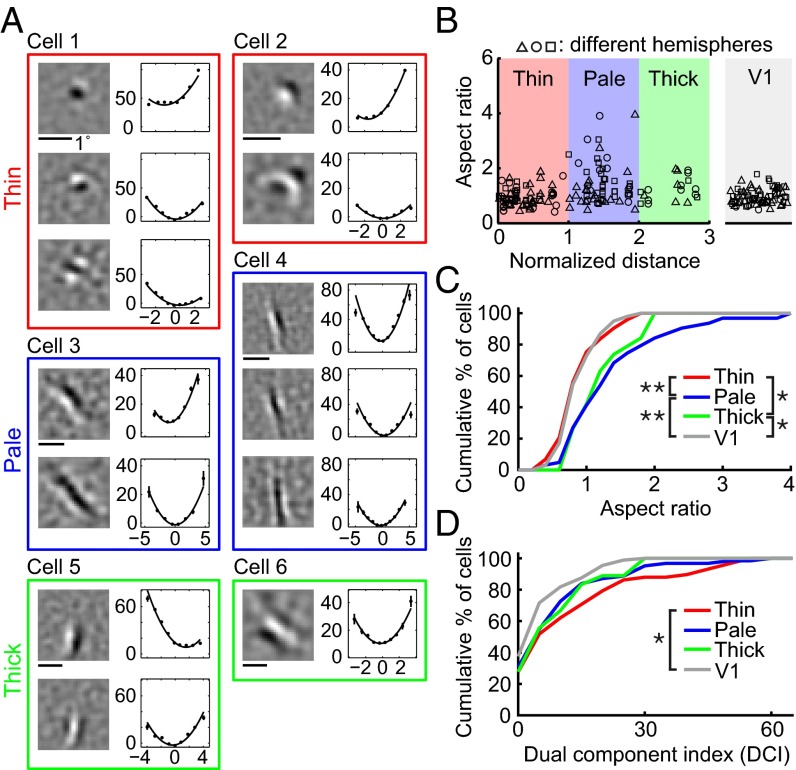
Fig. 4.
Organization of RF properties in V2 stripes. (A) Example RFs of six cells from thin (red), pale (blue), and thick (green) stripes. Eccentricity, 1.9°, 1.7°, 2.0°, 1.7°, 1.9°, and 0.9°. (B) (Left) Aspect ratio vs. normalized location across stripes (0, 1.5, and 3 represent center of thin, pale, and thick stripes, respectively). Data point with different symbol, aspect ratio of neuron from different hemispheres. (Right) Aspect ratios of V1 cells (randomly dispersed horizontally). (C) Cumulative distribution of aspect ratios of V1 (n = 99) and V2 cells in thin (n = 73), pale (n = 63), and thick (n = 19) stripes. Significant differences were found between V1 and V2 cells in pale or thick stripes and between V2 cells in thin and pale or thick stripes. (D) Cumulative distributions of DCI of V1 (n = 88) and V2 cells in thin (n = 58), pale (n = 62), and thick (n = 18) stripes. Significant difference was found between V1 and V2 cells in thin stripes.

