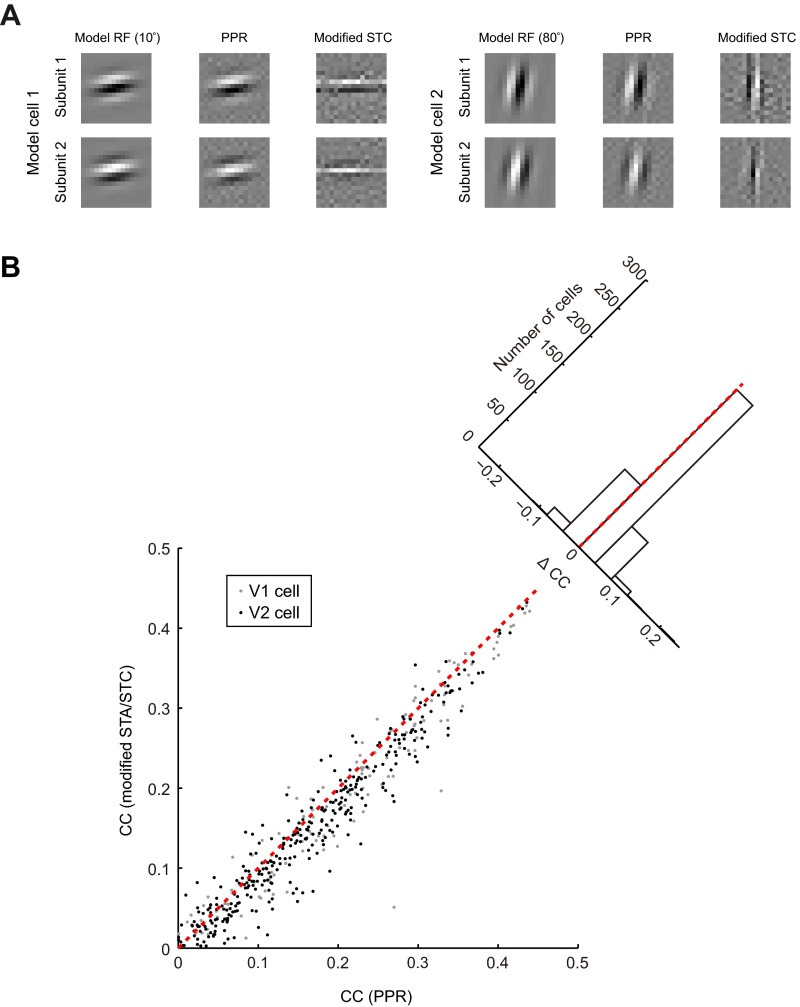
Fig. S1.
Comparison of PPR with modified spike-triggered average or spike-triggered covariance (mSTA/STC) method. (A) For both model cells: (Left) RFs of model cells; (Center) RFs estimated by PPR; (Right) RFs estimated by modified STC. The distortion of RF by modified STC was most prominent when the orientation of model cell was near horizontal or vertical (e.g., orientation 10° or 80°). (B) Comparison of CCs for measured (test data) and predicted responses between RFs computed by mSTA/STC and PPR for both V1 (gray, n = 124) and V2 (black, n = 360) cells. Each dot represents one cell. Red dashed line, unit line. (Inset) Distribution of delta CC between PPR and mSTA/STC.

