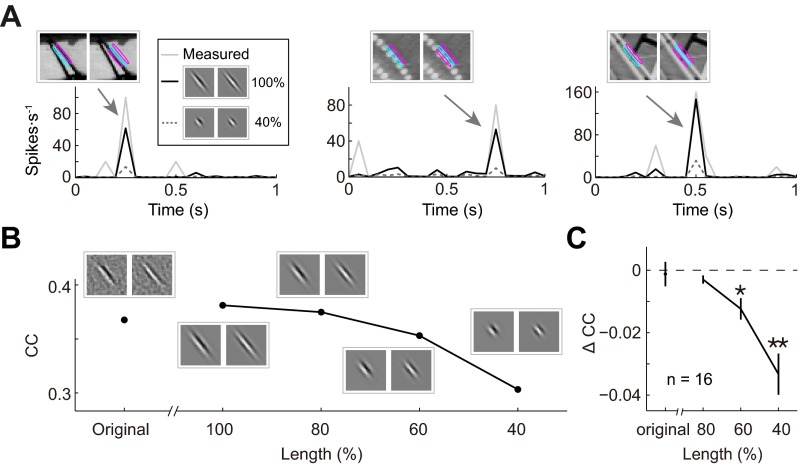
Fig. S3.
Performance of RF models with ultralong subunits. (A) Prediction of responses by Gabor-fits of an ultralong RF (two subunits) and by shortened Gabors (40% of original). Arrows, example responses to the above stimuli, which was showed overlapping with RF contours. Note that all stimuli contained long edges aligned with the RF. (B) CCs between measured and predicted responses (of test dataset) by original RF subunits (computed from PPR), Gabor fits of the subunits, and progressively shortened Gabor. (C) Summary of analysis in B for all cells with AR > 2 (n = 16) by comparing the CC change with the best Gabor fits. The CC decrease is significant by shortening to 60% and 40%.

