Fig. 2.
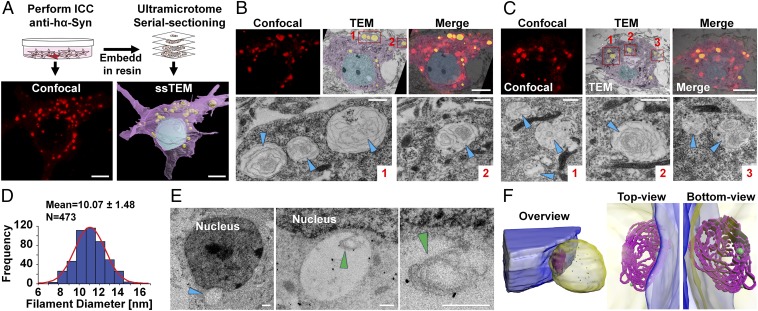
Ultrastructure of hα-Syn inclusions in SNCA−/− neurons. (A) For CLEM analysis, a stained neuron was imaged by confocal microscopy and then was reprocessed and imaged by TEM, resulting in a high-resolution 3D acquisition of the neuron. For illustration, the nucleus is rendered in blue, the cytosol in purple, and inclusions in yellow. (Scale bars: 5 µm.) (B) To correlate structures observed by ssTEM and fluorescence, single-plane images were superimposed. High-resolution images of inclusions (red boxes 1 and 2) are shown in the lower panel, with arrowheads indicating filamentous structures. (Scale bars: 5 µm in the upper panel and 2 μm in the lower panel.) (C) Same analysis as in B on different confocal and ssTEM planes from the same neuron. (D) Most filaments observed by ssTEM (n = 473) have a width ranging from 7–13 nm. The frequency histogram and normal curve (in red) are shown, as well as values of mean ± SD. (E) Immunogold labeling of SNCA−/− neurons expressing hα-Syn with the ab-6176 anti-synuclein antibody establishes that filaments are positive for synuclein. Different magnifications of the inclusion (blue arrowhead) and filaments (green arrowheads) are shown. (Scale bar: 1 µm in the left panel and 125 nm in the middle and right panels.) (F) A 3D model of the inclusion (blue arrowhead in E) reveals a mesh of intertwining filamentous structures (in purple) with gold particles reacting with the inner and outer portions. The nucleus is rendered in blue, the inclusion in yellow, and immunogold particles in green. Different views of the inclusion are shown.

