Fig. 4.
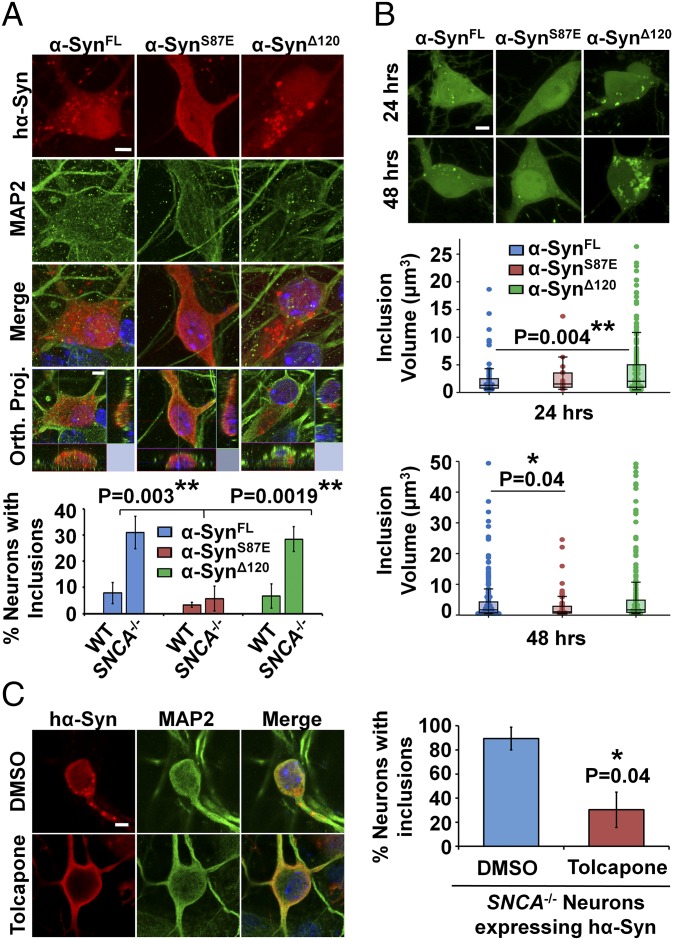
hα-Syn inclusion formation in SNCA−/− neurons reflects an aggregation-driven process. (A) Significantly fewer SNCA−/− neurons expressing α-SynS87E develop inclusions (>1 µm) than their α-SynFL and SynΔ120 counterparts (mean ± SD, n = 3 independent experiments with 25 neurons per condition). (B) Live imaging and 3D rendering of inclusions (50 neurons per condition) show that mEOS2–α-SynΔ120 forms significantly larger inclusions 24 h posttransfection than mEOS2–α-SynWT, and that the mEOS2–α-SynS87E mutant forms smaller inclusions at 48 h in SNCA−/− neurons. (C) Significantly fewer tolcapone-treated SNCA−/− neurons expressing hα-Syn (25 neurons per condition) develop inclusions (>1 µm) than DMSO-treated controls (mean ± SD, n = 3 independent experiments). In A the one-way ANOVA and Scheffé post hoc analysis were applied, and in B and C the Mann–Whitney test was applied to obtain P values. Orth. Proj., orthogonal projection. (Scale bars: 5 µm.)

