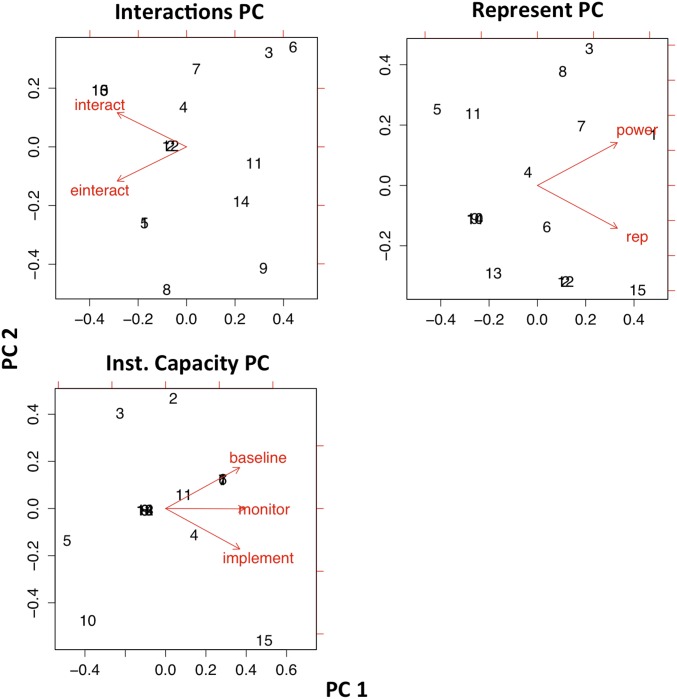
Fig. S1.
PCA biplots. We reduced the dataset by combining the following highly correlated variables. Represent PC, power and representation (correlation coefficient = 0.74); Interactions PC, in-person interactions and electronic interactions (correlation coefficient = 0.72); Inst. Capacity PC, institutional capacity to measure baseline conditions, monitor changes, and implement policies (paired correlation coefficients of 0.70, 0.79, and 0.80). In subsequent analyses, we used PC1 for predictor variables (or the inverse of Interactions PC1, so that increases in the principal component correlated to increases in the underlying variables).

