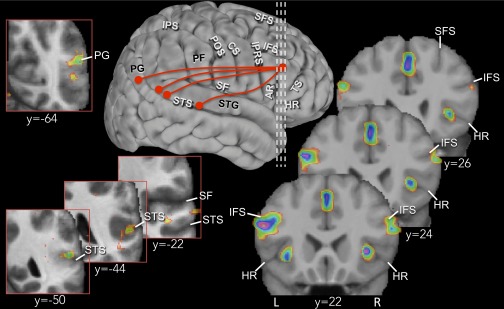
Fig. 2.
Results from the comparison of the experimental active retrieval and recognition control trials. The vertical interrupted white lines projected onto a three-dimensional cortical surface rendering of the right hemisphere indicate the rostrocaudal levels (y 22, 24, 26) in the MNI standard stereotaxic space of the three coronal sections that illustrate the bilateral activity increases observed in ventrolateral areas 45 and 47/12. The red circles on the surface rendering along the superior temporal gyrus and sulcus as well as in area PG indicate the loci of peaks that interacted with right area 45 during active retrieval. These peaks (y −22, −44, −50, −64) are illustrated within the boxes outlined in red. AR, ascending ramus of SF; CS, central sulcus; HR, horizontal ramus of SF; IFS, inferior frontal sulcus; IPRS, inferior precentral sulcus; IPS, intraparietal sulcus; L, left hemisphere; PF, area PF of Economo; PG, area PG of Economo; POS, postcentral sulcus; R, right hemisphere; SF, Sylvian fissure; SFS, superior frontal sulcus; STG, superior temporal gyrus; STS, superior temporal sulcus; TS, triangular sulcus.

