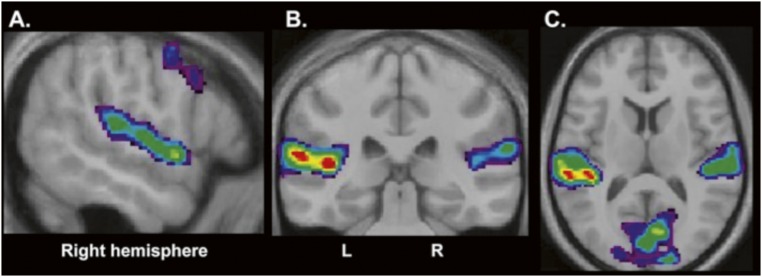
Fig. S1.
Results from the comparison of the test period of all trials in which a sound was presented (i.e., active retrieval and recognition control trials) with the baseline control trials in which no sound was presented. (A) Sagittal section at x 56 to illustrate the activity increases along the right superior temporal gyrus in the primary and secondary auditory areas. (B and C) Coronal section at y −32 (B) and horizontal section at z 10 (C) to illustrate bilateral increases in activity in the planum temporale and Heschl’s gyri.

