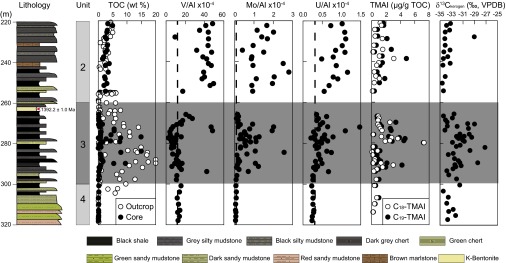
Fig. 1.
Geochemistry, biomarker, and δ13C of kerogen for the Xiamaling Formation from the top of unit 4 to the bottom of unit 2. TOC, from both the core and outcrop samples are presented. Data include both black shales and other sediment types like cherts. Vertical dotted lines represent concentration ratios relative to crustal average (see Supporting Information and Tables S1 and S2).

