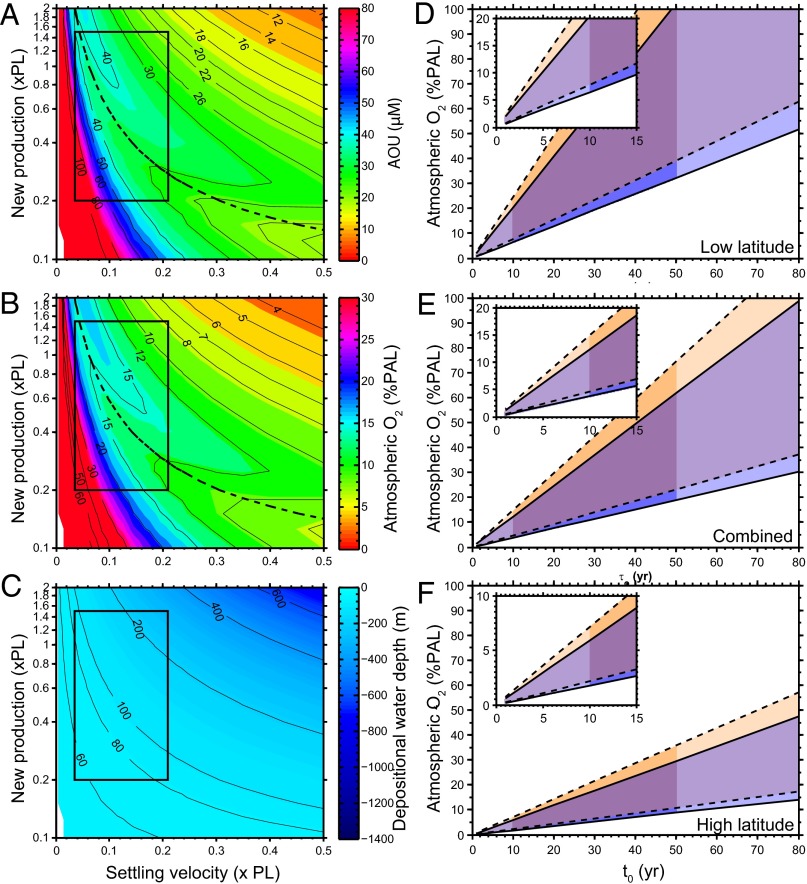
Fig. 3.
(A) Calculated minimum oxygen utilization (AOU) for water masses circulating to oxygenated waters beneath the anoxic portion of an OMZ. This calculation is calibrated to a Xiamaling Formation organic carbon burial flux calculated from 15 wt% TOC, with organic matter reactivity as calculated from the mean of all sediment trap data, and a temperature−depth distribution as for the present tropical Atlantic Ocean. The black box outlines new production rates ranging from 0.2 to 1.5 times present values (xPL), with the present value as observed in the equatorial Atlantic (Supporting Information), and particle settling rates between 1 m⋅d−1 and 6 m⋅d−1 (they are presented as a fraction, xPL-present level, of the diagnosed particle settling rates from the sediment trap data as described in Supporting Information). The dotted line indicates the solutions for the 100 m depth contour. (B) Values of AOU converted to percent present atmospheric oxygen levels (%PAL) assuming water saturation with air at the temperature for the water depth diagnosed in the calculation. (C) Water depths diagnosed by matching the particle settling flux with the burial flux of organic matter into Xiamaling Formation sediments. The stippled line represents water depths of less than 100 m, which we consider unlikely given the deep-water depositional setting of the Xiamaling Formation. (D) Sensitivity analyses depicting the high and low oxygen estimates for a series of calculations with variable water residence times (τo) assuming low organic matter reactivity as found in modern low latitudes. Calculations with the present-day temperature−depth distributions are shown in blue shades, and calculations with this temperature profile +10 °C are shown in brown. A large overlap is observed. The darkened area outlines the most likely range of water ages. (E) As in D, but assuming organic matter reactivity from the combined sediment trap data. (F) As in D, but assuming high organic matter reactivity as found in modern high latitudes. See Constraining Atmospheric Oxygen Levels and Figs. S5–S8 and Tables S3–S7 for details.

