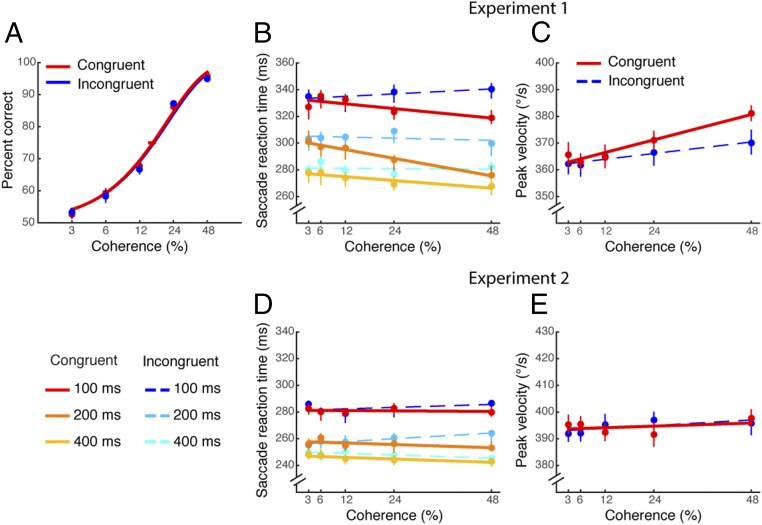
Fig. 2.
Psychometric functions and saccade metrics in Exps. 1 and 2. (A) The psychometric functions for congruent vs. incongruent conditions, depicted by red and blue lines, respectively. The error bars on the data points reflect SEM across observers, and the horizontal error bars on the 75% accuracy threshold indicate bootstrapped 68% confidence intervals (CIs). (B and C) Saccade reaction times (B) and saccade peak velocities (C) as a function of motion coherence in Exp. 1. (B) Color-scaled data represent viewing duration in the congruent and the incongruent condition (red vs. blue: 100 ms, orange vs. light blue: 200 ms, and yellow vs. cyan: 400 ms). (C) Red and blue indicate saccade peak velocities in the congruent and incongruent conditions, respectively. Solid and dashed lines are the best-fitting lines for the congruent and incongruent conditions, respectively. Error bars are bootstrapped 95% CIs. (D and E) Saccade reaction times (D) and saccade peak velocities (E) as a function of motion coherence in Exp. 2.

