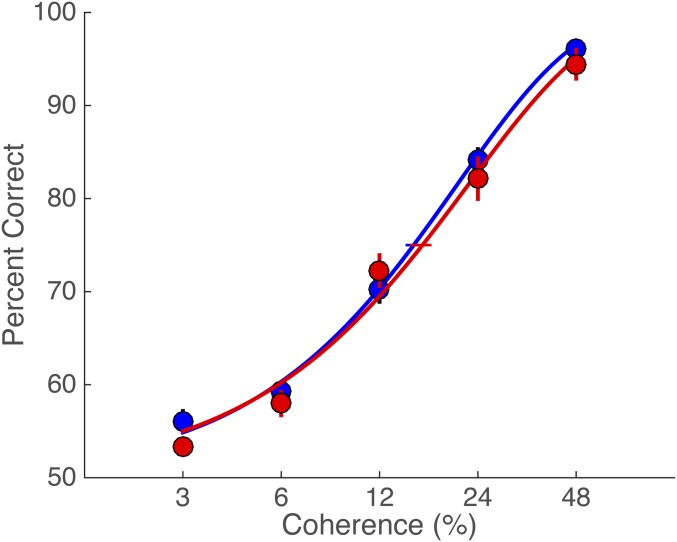
Fig. S5.
Psychometric functions in Exp. 3 (blue) and Exp. 4 (red). The horizontal error bars represent 68% CIs around 75% accuracy threshold from 1,000 bootstrapped fits. In Exp. 3, threshold is 15.27% and CI = (14.48, 15.52), and in Exp. 4, threshold is 16.25% and CI = (15, 16.89). These results suggest that the different results in Exps. 3 and 4 were not caused by different behavioral performance on motion-direction discrimination tasks in each experiment.

