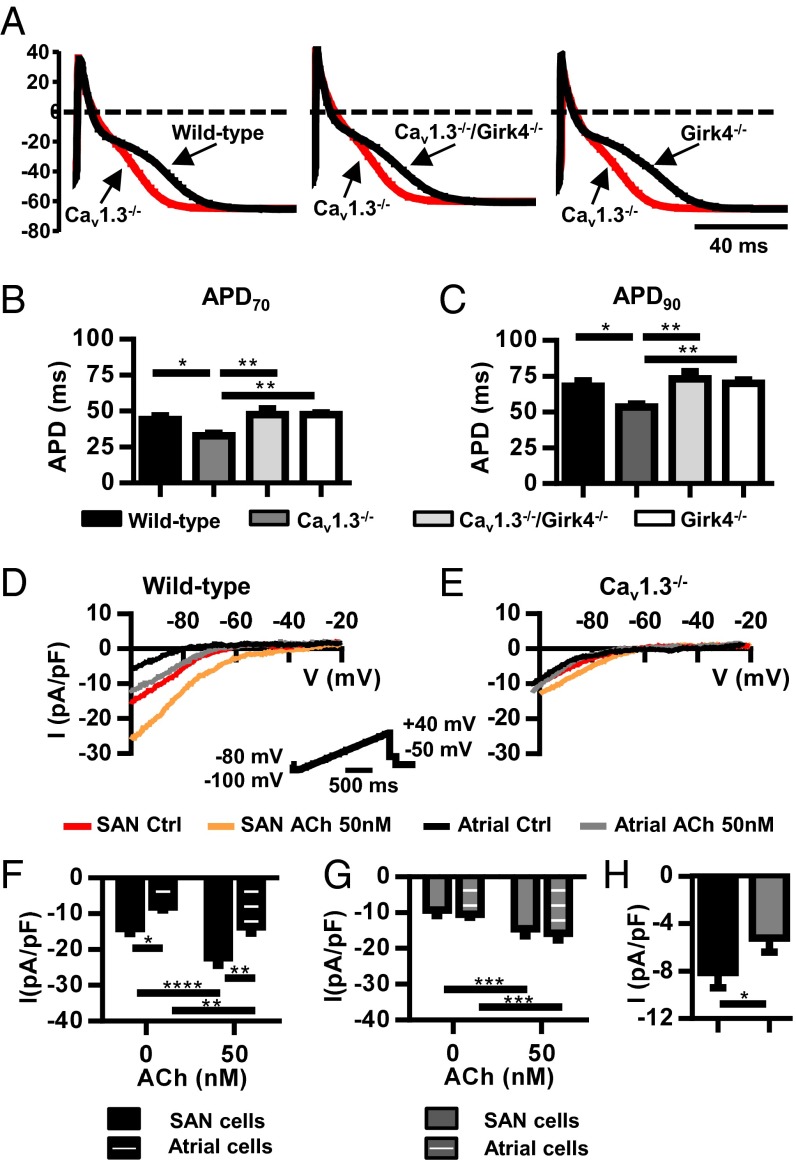
Fig. 4.
Normalization of action potential duration of Cav1.3−/− atrial myocytes after IKACh ablation. (A) Action potential sample traces of Cav1.3−/− atrial myocytes (red trace) overlapped with action potentials from WT (Left), Cav1.3−/−/Girk4−/− (Middle), or Girk4−/− myocytes (Right). Action potential durations at 70% (B, APD70) and 90% (C, APD90) of repolarization in n = 14 WT, n = 13 Cav1.3−/−, n = 19 Cav1.3−/−/Girk4−/−, and n = 17 Girk4−/− myocytes are shown. Statistics: one-way ANOVA followed by Holm–Sidak’s multiple comparisons test. Sample traces of IKACh before and after ACh perfusion (0.05 μM) in SAN and atrial myocytes of WT mice (D) and Cav1.3−/− mice (E) are shown. (D, Inset) Voltage clamp protocol. Averaged IKACh densities before and after ACh are shown in the bar plots for SAN (n = 14) and atrial WT myocytes (n = 11) (F) and SAN (n = 18) and atrial Cav1.3−/− myocytes (n = 15) (G). (H) IKACh induced by ACh perfusion measured by subtracting the basal current from the basal current in ACh. Statistics: two-way ANOVA followed by Sidak’s multiple comparisons test. *P < 0.05; **P < 0.01; ***P < 0.001; ****P < 0.0001.

