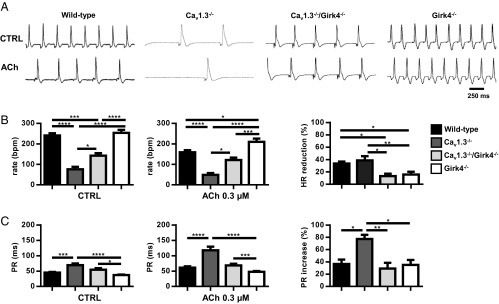
Fig. 5.
ACh (0.3 μM) effect on heart rate and AV conduction in isolated Langendorff-perfused hearts. (A) Representative traces in CTRL conditions (Top) and ACh-perfused (Bottom) hearts from WT, Cav1.3−/−, Cav1.3−/−/Girk4−/−, and Girk4−/− mice. (B) Mean value of heart rate in control (Left; n = 13 WT, n = 8 Cav1.3−/−, n = 7 Cav1.3−/−/Girk4−/−, and n = 16 Girk4−/− hearts) and ACh-perfused (Middle; n = 12 WT, n = 9 Cav1.3−/−, n = 7 Cav1.3−/−/Girk4−/−, and n = 16 Girk4−/− hearts) hearts. (Right) ACh-dependent heart rate reduction expressed as percentage measured in the different mouse strains studied. (C) Mean value of PR interval in Tyrode’s solution (n = 9 WT, n = 9 Cav1.3−/−, n = 8 Cav1.3−/−/Girk4−/−, and n = 10 Girk4−/− hearts; Left) and ACh (n = 9 WT, n = 9 Cav1.3−/−, n = 8 Cav1.3−/−/Girk4−/−, and n = 8 Girk4−/− hearts; Middle) perfused hearts. (Right) ACh-dependent PR interval reduction expressed as percentage. Statistics: one-way ANOVA followed by Tukey’s multiple comparisons test. *P < 0.05; **P < 0.01; ***P < 0.001; ****P < 0.0001.

