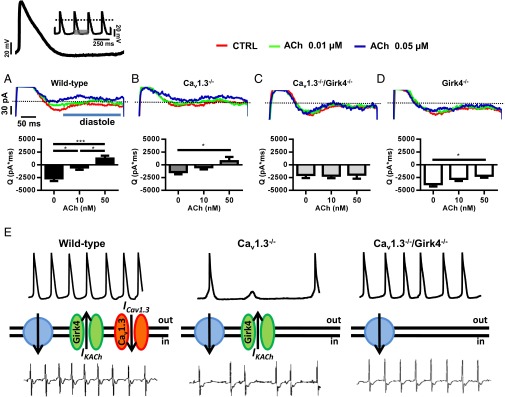
Fig. 8.
Diastolic current in isolated Cav1.3−/− and Cav1.3−/−/Girk4−/− SAN myocytes and heart rate determination. Sample traces (Upper) and averaged current time integrals (Bottom) measured between the voltage corresponding to the maximum diastolic potential (−61 mV) and the following action potential threshold (−42 mV) of a sample mouse SAN action potential used as voltage-clamp command. Slopes of the linear and exponential parts of the diastolic depolarization were 0.03 and 0.98 mV⋅ms−1, respectively. (A, Upper) Voltage-clamp protocol is shown. Current was measured under control conditions and after perfusion of 0.01 or 0.05 μM ACh in n = 9 WT (A), n = 7 Cav1.3−/− (B), n = 16 Cav1.3−/−/Girk4−/− (C), and n = 8 Girk4−/− (D) SAN myocytes. *P < 0.05; ***P < 0.001. (E) Statistics: one-way ANOVA followed by Holm–Sidak’s multiple comparisons test. The model of the mechanism of rescue is based on the relationship between the inward-outward current balance that determines the diastolic depolarization and the rate and stability of heart beat. In each panel, sample SAN action potentials (Top), functional ionic currents contributing to the diastolic depolarization (Middle), and sample ECG recordings (Bottom) are shown. The green channel represents IKACh, the red channel represents Cav1.3-mediated ICa,L (ICav1.3), and the blue circle shows the idealized sum of other inward currents involved in the pacemaker mechanism (INCX, If, ICa,T). (Left to Right) Samples of ECG recordings and of pacemaker activity in WT, Cav1.3−/−, and Cav1.3−/−/Girk4−/− mice are shown.

