Fig. 6.
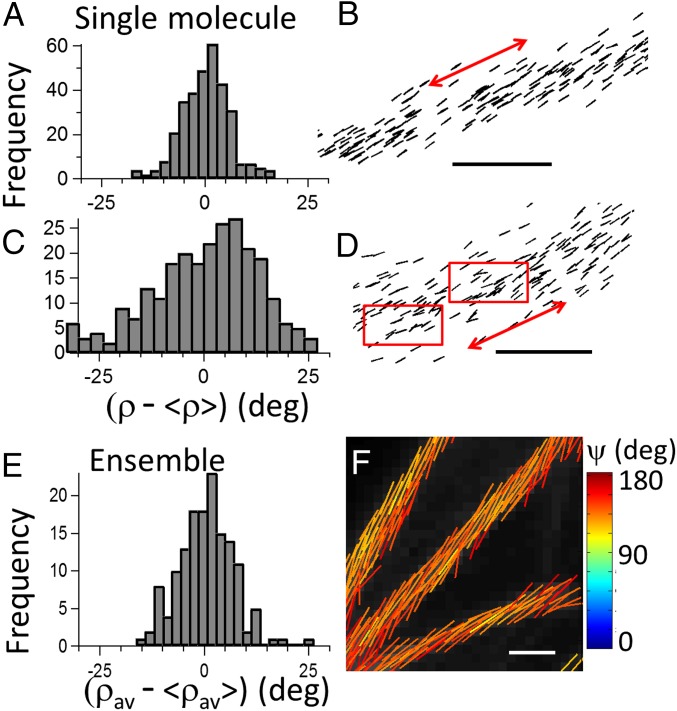
Comparison of nanoscale and diffraction-scale structural imaging in actin stress fibers (labeled with Alexa Fluor 488–phalloidin conjugate). (A) Reconstruction of single-molecule orientations using polar-dSTORM data, in an actin fiber portion oriented close to 45° and incorporating in the estimation the wobbling angle = 90°: histogram of molecular orientations with respect to the averaged population (), evidencing high degree of homogeneity. (B) Corresponding polar-dSTORM image where directions are represented by sticks oriented by the angle relative to the horizontal axis (the red arrow points the averaged fiber direction). (C) Same analysis in a heterogeneous actin filament, with (D) its polar-dSTORM image, where red rectangles point out regions of structural heterogeneity. (E and F) Ensemble confocal polarization-resolved fluorescence measurement (optical resolution, 200 nm) on actin stress fibers with the same label. The average fluorophores orientation and the angular aperture ψ of their distribution in each pixel are determined by fitting tunable polarization data (Materials and Methods). (E) Histograms of averaged orientations along a fiber portion of 2-μm length. (F) Each fitted pixel is represented by a stick encoded with its orientation angle and a color following the ψ color scale. The fluorescence intensity is in gray scale. [Scale bars: 100 nm (B and D) and 1.5 μm (F).]

