
Figure 2. Brain BDNF expression level modifies the association of AD pathology and the rate of cognitive decline.
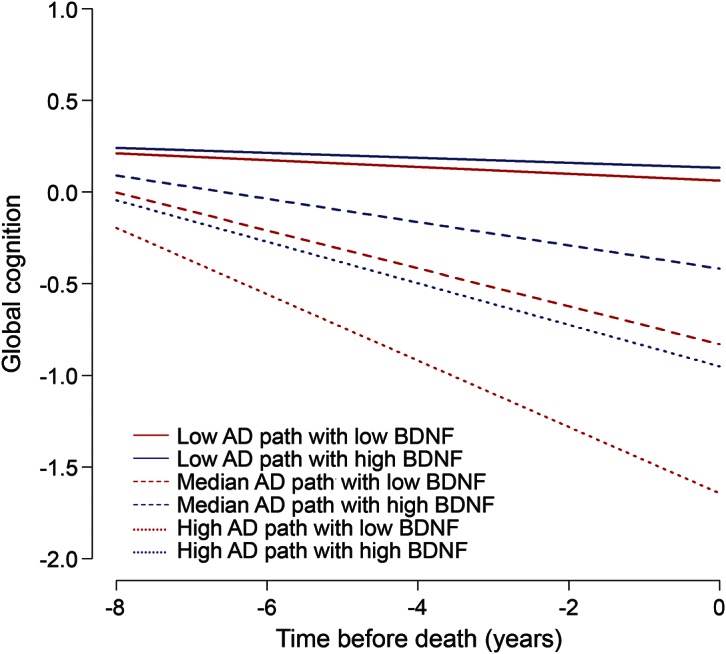
To display this association, 3 pairs of hypothetical average participants with their estimated rate of cognitive decline based on the complete model with a 3-way interaction term with all the cases analyzed in this study are illustrated. Model derived trajectories of cognitive decline for participants with low (red, 10th percentile) and high (blue, 90th percentile) brain BDNF gene expression levels with 3 levels of AD pathology: low (10%, solid), median (50%, dashed), and high (90%, dotted). At all levels of AD pathology, the rate of cognitive decline is slower in individuals with high levels of BDNF (blue) vs low BDNF expression levels (red). It is evident that the difference in slopes of cognitive decline between the high levels of BDNF expression (blue) and low levels of BDNF expression (red lines) is much greater for the dashed lines (high AD pathology) as compared to the solid lines (low AD pathology). AD = Alzheimer disease; BDNF = brain-derived neurotrophic factor; path = pathology.