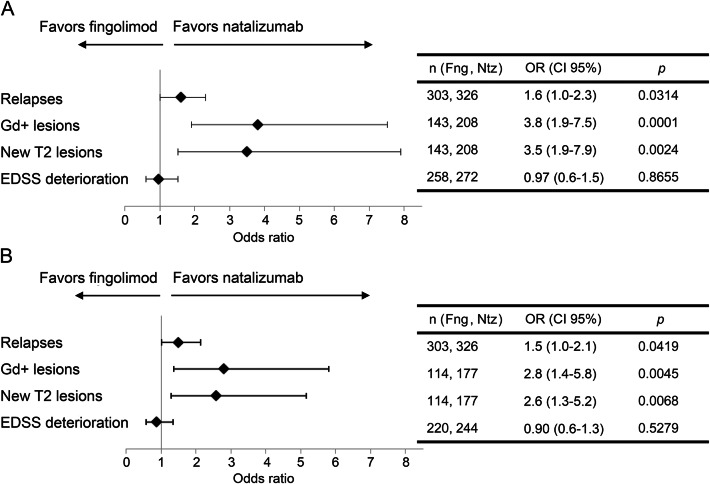
Figure 2. Adjusted multivariate logistic regression on clinical and radiologic disease activities according to treatment group.
Multivariate analyses were represented as Forest plots at (A) 1 and (B) 2 years of treatment. The covariates used for adjustment were sex, number of relapses during the year prior to fingolimod or natalizumab treatment onset, presence of Gd-enhancing lesion at baseline MRI, EDSS baseline score, and university hospital as a random effect. CI = confidence interval; EDSS = Expanded Disability Status Scale; Fng = fingolimod; Gd = gadolinium; Ntz = natalizumab; OR = odds ratio.

