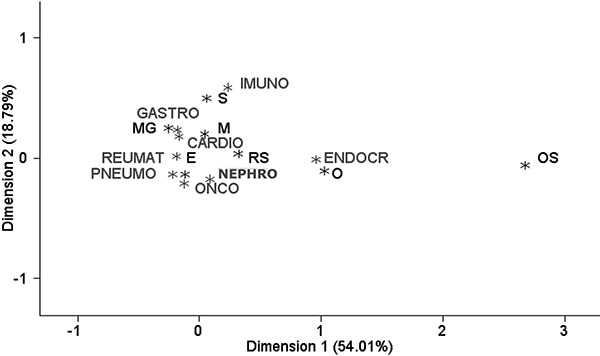
Figure 2. Map of correspondence for nutritional status according to body mass index for age of the patients in the hospitalized group by medical specialties. OS: severe obesity; O: obesity; S: overweight; RS: risk of being overweight; E: eutrophic; M: thinness; MG: severe thinness; IMUNO: immunology; GASTRO: gastroenterology; REUMAT: rheumatology; NEPHRO: nephrology; CARDIO: cardiology; ONCO: oncology/hematology; PNEUMO: pulmonology; ENDOCR: endocrinology.

