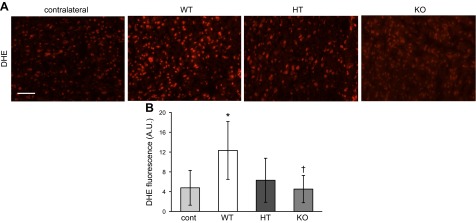
Figure 5.
Superoxide levels in stroke-affected tissue are increased by excessive brain αTOC. A) Representative photomicrographs of DHE staining in contralateral (control) and stroke-affected S1 cortex of TTP WT, HT, and KO mice; scale bar = 50 μm. B) Percent area of DHE fluorescence was used to quantify superoxide levels. Data are mean ± sd, n = 3. *P < 0.05 vs contralateral; †P < 0.05 KO vs. WT.

