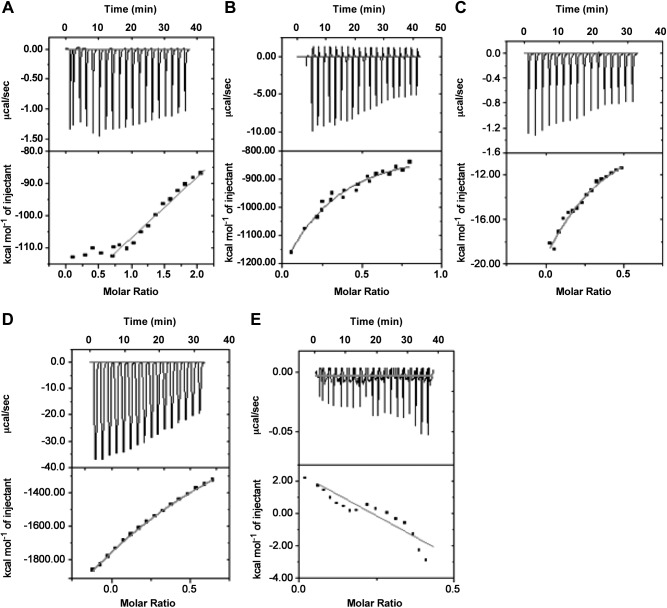
Figure 5.
Data obtained from ITC binding experiment between membrane lipids and major components of fungal plasma membrane with peptide Cm-p5. Figure representing the integration of raw heat associated thermogram (top) and isotherm (bottom) of each individual set of interaction. A–E) The interaction represents Cm-p5 with PC (A), PS (B), PE (C), ergosterol (D), and chitin (E). Data are corrected by subtraction of appropriate blank experiments and then fitted with nonlinear regression; data derived after analysis are listed in Table 3.

